Start here · understand the lesson before the detail
What you are learning
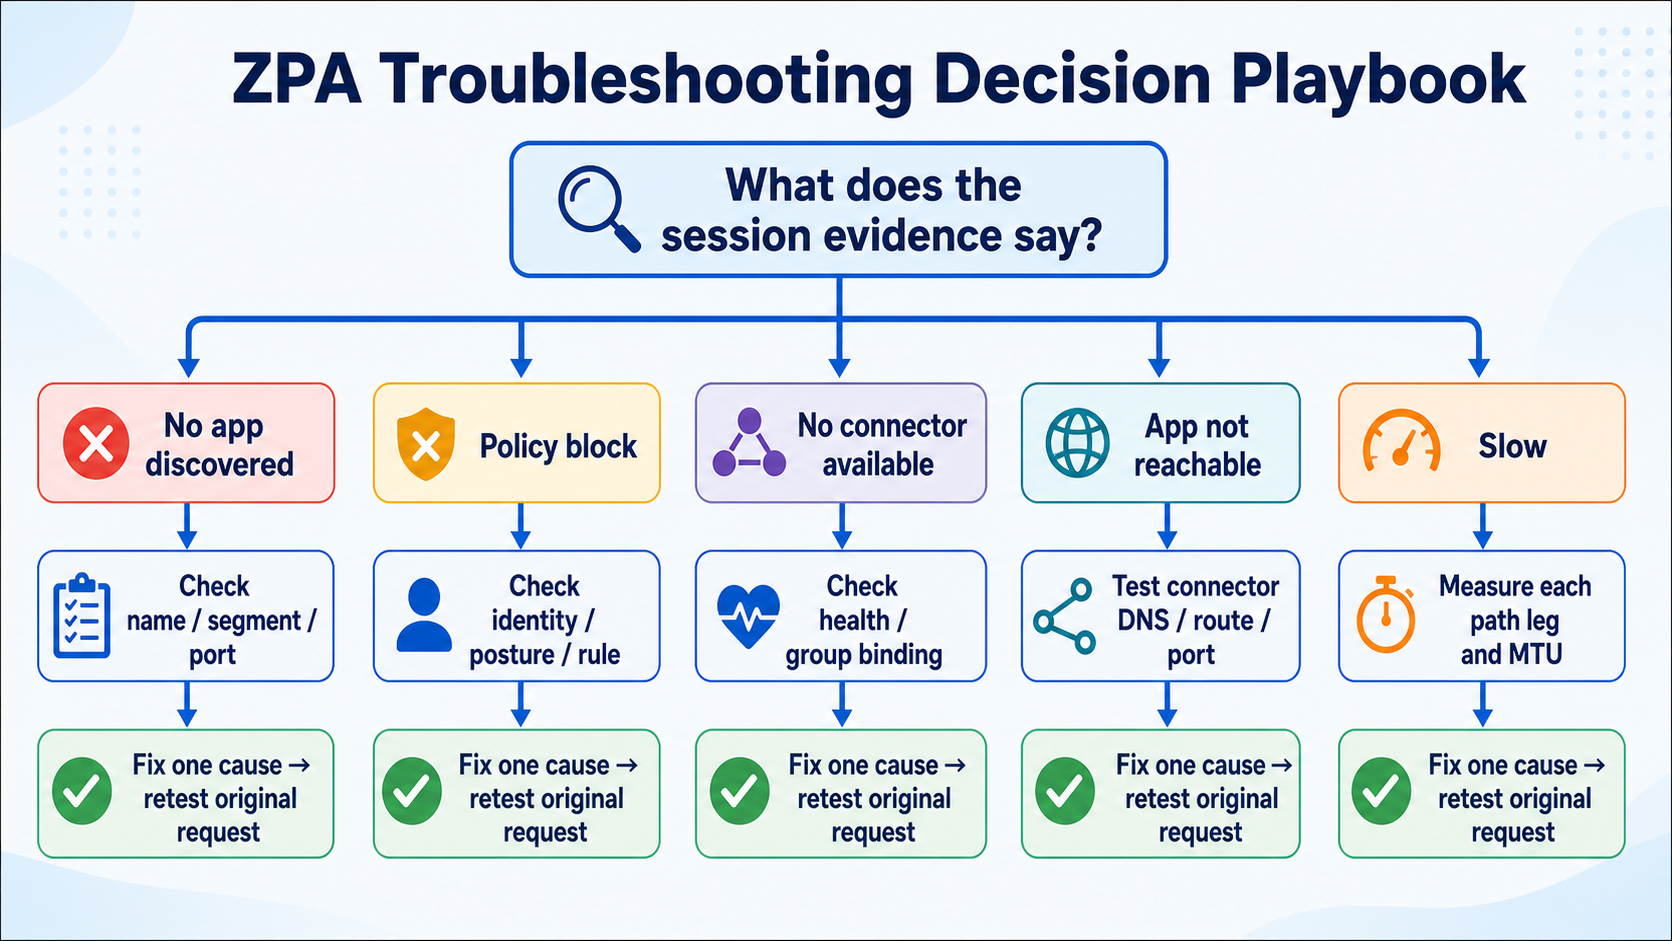
This lesson is a decision playbook for real ZPA incidents. Begin with the exact session evidence, choose the matching branch, and avoid wasting time on healthy layers.
In plain English
Different symptoms leave different evidence. No discovered app points toward name, segment, and port matching. A policy block points toward identity, posture, and rule order. No connector points toward eligibility and health. An unreachable app points toward the connector-to-app path.
Real example
A user reports 'timeout,' but diagnostics show POLICY_BLOCK. The browser description is vague; the ZPA action is precise. Check the matched user, posture, application, and rule rather than restarting the connector or changing DNS.
Follow this flow
- Find the exact request in diagnostics and copy its status and matched objects.
- Choose the discovery, policy, connector, app-reachability, or performance branch.
- Check only the evidence named by that branch.
- Compare with one working case and identify the first difference.
- Fix one cause, repeat the original request, and document closure.
Evidence to collect
- No event, discovered app, or matched application segment
- Identity, posture, policy rule, and block reason
- Eligible connector group, connector ID, and health
- Private DNS, route, port, latency, MTU, and app response
Common mistake to avoid
Do not let the user’s phrase 'not working' choose the technical branch. The session event, or the absence of one, is stronger evidence. Preserve it before making a change.
Current official source checkpoint
- App Connector troubleshooting runbookcurrent official reference used for this beginner explanation
- ZPA performance runbookcurrent official reference used for this beginner explanation
Key terms before you continue
Stop fixing ZPA. Start isolating layers.
Most engineers attack a "ZPA app is down" ticket by guessing a subsystem — "must be the connector," "must be policy" — and burn an hour in the wrong console. Wrong move. A ZPA request crosses five layers in order: L1 Client (ZCC) → L2 Edge/Broker (Service Edge) → L3 Connector (App Connector) → L4 App/Network (DNS + last-mile) → L5 Policy (Access Policy + identity). The app is down because exactly one of those layers failed. Find the layer first; the fix is then a short walk to the right lesson.
Think of a power cut at home. You don't rewire the whole house — you check the bulb, then the switch, then the fuse, then the meter, then the street line, in order, and stop at the first thing that's dead. ZPA triage is the same disciplined five checks. This blog is a triage hub, not another deep-dive: it teaches the isolation method and then hands you off to the lesson that owns each layer. That's the aha-moment: "connector healthy" is data about ONE layer (L3), not the whole chain — so a green connector actually narrows the fault to L1, L4, or L5.
The five layers, in 30 seconds each
Is ZCC enrolled, the ZPA service ON, and the tunnel up? If not, traffic never enters ZPA. Tool: ZCC > More > Connection Status / Export Logs. Lesson: ZCC Troubleshooting.
Did the device reach a healthy, near Public/Private Service Edge (the broker)? Tool: Portal Diagnostics + ZCC ZPA status. Lesson: ZPA vs VPN / Private Service Edge.
Is a healthy connector serving THIS app — right version, not at capacity? Tool: journalctl -u zpa-connector + Portal health. Lesson: App Connector Troubleshooting / Deploy.
L4: can the connector resolve + TCP-reach the server (dig/nc)? L5: does a rule ALLOW it (Diagnostics policy result)? Lessons: DNS & App Discovery · Access Policy.
① Isolate the layer — the 5-layer method
This is the whole game. Instead of asking "what's broken?", ask "which layer is broken?" and check each one with a single yes/no signal. The instant a layer answers "no", you've found your bucket — and the lesson that fixes it. Two ways to walk the layers:
Top-down (L1 → L5) when one user or one device is affected — start at their laptop and move outward. Bottom-up (L5 / L4 → L1) when the same app is down for everyone — a shared fault almost always lives in policy or the app/network layer, so don't waste time on individual clients. And remember the shortcut: a green connector proves L3, so it tells you to look at L1, L4, or L5.
▶ Watch the 5-layer isolation walk
Sneha at Infosys reports SAP is down. Press Play — each layer lights up with its check; red = the layer where this ticket actually fails.
journalctl -u zpa-connector + Portal health. Connector green — L3 passes.dig + nc the SAP server?
dig sap.corp.local → 10.50.7.40, nc -vz 10.50.7.40 443 open. L4 passes.Policy + Close — the ALLOW rule references a SCIM group that was renamed."Sneha at Infosys says SAP is down" — walk L1 → L5
Symptom One user, one app: Sneha can't open sap.corp.local. Connector looks green.
L1 Client ZCC enrolled, ZPA ON, tunnel up? Yes — Connection Status is green. Pass.
L2 Edge Reached a healthy near Service Edge? Yes — Portal Diagnostics shows a brokered session. Pass.
L3 Connector Healthy connector serving SAP? Yes — green, current version, low load. Pass (so the fault is NOT the connector).
L4 App/Net From the connector host, dig sap.corp.local → 10.50.7.40, nc -vz 10.50.7.40 443 open. Pass.
L5 Policy FAIL. Diagnostics shows empty Policy + Close: the ALLOW rule references SCIM group SAP-Users, but identity renamed it to SAP_Users. Fix = repoint the rule → app back. Lesson: Access Policy.
Username        : sneha.r@infosys.com
Host            : sap.corp.local
ConnectionStatus: Close
Policy          : (empty)          <- no rule matched = L5 miss
Connector       : connector-mumbai-01   <- named => L3/L4 were fine
ConnectionStatus: Open
Policy          : "Allow-SAP-Users"
ServerIP        : 10.50.7.40
ConnectionSetupTime: 38 ms
Same SAP outage, but now the whole office reports it at 9am. Do you still walk top-down from Sneha's laptop?
Pick the isolation direction from the blast radius
One user Walk top-down L1 → L5: their ZCC, their broker session, the connector, the app reachability, then policy. The fault is usually personal (tunnel down, attribute missing).
One office Walk bottom-up but start at L2 Edge — a single sick Service Edge or a site-wide forwarding change hits everyone in one location.
Everyone Walk bottom-up L5 → L4: a policy edit, a renamed identity group, a server-group rebinding, or DNS — the shared objects. Never start at 5,000 laptops.
Shortcut Connector green = L3 proven. Cross it off and look at L1 / L4 / L5 only.
Lesson Once you know the layer, open its deep-dive (see the router table below) instead of re-deriving the fix here.
"Connector is green but the app is still down"
Symptom Portal connector health = Connected, yet users can't open the app.
What it proves ONLY that L3 is healthy — the connector reached the broker and is alive. It says nothing about L1, L4, or L5.
So check L1 (is the user's tunnel actually up?), L4 (can the connector resolve + reach this server, or did DNS/last-mile break?), L5 (does a rule allow it?).
Trap A green connector in the wrong server/connector group still can't serve the app — that's an L3/L4 binding fault, not a connector-health fault. The light is green; the wiring is wrong.
Lesson App Connector Troubleshooting (L3) for health; DNS & App Discovery (L4) for reachability.
In the 5-layer method, what does a green (Connected) App Connector prove?
② The Diagnostics page tour — let the field name the layer
You don't have to guess the layer — ZPA's own Diagnostics page tells you. Open Analytics → Diagnostics → User Activity for the failing request and read which field is wrong. Each field maps to a layer. This is the single most powerful skill in the whole playbook: the field that's wrong is the layer.
Read User Activity top-down: four fields, four layers
Empty Policy + Close No rule matched → L5 Policy (missing ALLOW, or an identity/SCIM/SAML miss). Open the Access Policy lesson.
Empty Connector ZPA never picked a connector → L3/L4 binding (server group → connector group eligibility rejected all). Open Groups & Service Edge / App Connector lessons.
Named + slow A named connector with a high ConnectionSetupTime → L4 reachability (connector can't promptly reach the server — DNS or last-mile). Open DNS & App Discovery / Performance & MTU.
Open + app-side fail ZPA is clean but the app errors → L4/clientless (cert pinning, Browser Access TLS). Open Browser Access / PRA.
Where to look User Activity = per-request (status, policy, connector, timing). User Status / Authentication = the SAML/SCIM the IdP actually sent (L5 identity).
Two more diagnostics you'll reach for first
L1 Client On the laptop: ZCC > More > Connection Status (ZPA service = ON? tunnel up?) and Export Logs to attach to the ticket. If the tunnel is down, no Diagnostics row will ever appear — that itself is the L1 tell.
L2 Edge Portal Administration → Diagnostics shows the broker/Service Edge the session used; ZCC's ZPA status confirms a near, healthy edge was reached.
L3 Connector Portal connector health for "Connected", AND on the connector host journalctl -u zpa-connector -f. A healthy connector runs a parent + child process — parent-only means it's unhealthy.
Pro tip journalctl -n10000 zpa-connector | grep fohh_connection_connected proves the connector↔Service Edge channel (L2/L3) is up, with rx/tx byte counters.
Retention The admin console keeps roughly 14 days of activity; for longer history stream LSS to a SIEM (Splunk, etc.).
Prove (or disprove) app reachability in three commands
Symptom Diagnostics names a connector but the app still won't open, or setup time is high.
Resolve dig app.corp.local on the connector host — does it return the right server IP? A DNS failure here is often a permissions issue on /etc/resolv.conf for the zscaler user.
Reach nc -vz 10.50.7.40 443 (or curl -vk https://10.50.7.40) — can the connector open TCP to the server's port?
Read Resolve fails → L4 DNS (DNS & App Discovery lesson). Reach fails → L4 last-mile/firewall. Both pass but app still down → step back to L5 Policy.
Lesson DNS & App Discovery (resolution) and Performance & MTU (transport) own this layer.
User Activity log shows a named Connector but a high ConnectionSetupTime and the app is slow/timing out. Which layer is the fault, and which lesson do you open?
One User Activity row, read field by field
Row ConnectionStatus=Open · Connector=connector-pune-02 · ConnectionSetupTime=2900 ms · ServerIP=10.50.9.12
L5? Policy isn't empty and status is Open → a rule allowed it. L5 is fine.
L3? A connector is named → ZPA picked one. The binding (L3) is fine.
L4! Setup time of 2,900 ms is the smell — the named connector is struggling to resolve or reach 10.50.9.12. SSH to connector-pune-02 and run dig + nc. Lesson: DNS & App Discovery / Performance & MTU.
Takeaway You never opened the policy console or the segment config — the fields told you it was L4 in ten seconds.
A ticket says "app down". You open Diagnostics → User Activity and there is no row at all for that user and host. Which layer does the absence of a row point to?
ZCC > More > Connection Status first. A missing row is itself a signal: the request died before L2. Open the ZCC Troubleshooting lesson.③ The symptom → layer → lesson router
This is the heart of the hub. Match the symptom on the left to its likely layer, then open the deep-dive lesson that owns it. Don't re-learn the subsystem here — this table is the map; the lessons are the territory.
"No ZPA at all" / nothing is logged
Symptom No Diagnostics row; ZCC shows ZPA off / tunnel down / re-auth loop; only this user.
Likely layer L1 — the request never entered ZPA.
Go to lesson → ZCC Troubleshooting (enrollment, tunnel, service state, log export).
Everyone in one office is slow or down
Symptom A whole site degrades; sessions route to a distant or unhealthy Service Edge.
Likely layer L2 — the broker/Service Edge the device reached.
Go to lesson → ZPA vs VPN & Private Service Edge (broker model, on-prem Private Service Edge).
Connector unhealthy, wrong version, or none serving the app
Symptom Portal health red/flapping; empty Connector field; journalctl shows enrollment/handshake errors; parent-only process.
Likely layer L3 — connector health, or the server-group → connector-group binding.
Go to lesson → App Connector Troubleshooting · App Connector Deploy · Groups & Service Edge (the L3/L4 binding).
Named connector but slow / can't reach the server
Symptom High ConnectionSetupTime; dig fails on the connector host; works on 443 but not 8443; pinned-cert / clientless TLS fail with green ZPA.
Likely layer L4 — DNS resolution, last-mile reachability, transport/MTU, or the app-segment object chain.
Go to lesson → DNS & App Discovery · Performance & MTU · App Segments · Browser Access & PRA (clientless / cert).
Brokered fine, reachable — but denied or unmatched
Symptom Empty Policy + Close; a renamed/un-synced SCIM group; a SAML attribute the IdP isn't sending; posture/timeout blocking.
Likely layer L5 — Access Policy order, or the identity (SAML/SCIM) feeding it.
Go to lesson → Access Policy (rule order, criteria, identity) · App Segments (the object the rule targets).
No log → L1. Whole office → L2. Empty Connector / red health → L3. Named-but-slow / dig fails / clientless TLS → L4. Empty Policy + Close → L5. Pick the row, open the lesson — that's the whole hub.
A clientless (Browser Access) user gets a TLS error, but ZPA Diagnostics shows a clean Open with normal setup time. Which layer, and which lesson?
Use the table on a live ticket
Ticket A "App down, no Diagnostics row." → No log = L1 → open ZCC Troubleshooting. (Found it: ZPA service was toggled off on the laptop.)
Ticket B "Empty Connector field." → L3 binding → open Groups & Service Edge. (Server group pointed at a disabled connector group.)
Ticket C "Open + 3s setup, dig fails on host." → L4 DNS → open DNS & App Discovery. (resolv.conf perms for the zscaler user.)
Ticket D "Empty Policy + Close." → L5 → open Access Policy. (ALLOW rule referenced a renamed SCIM group.)
Takeaway Four tickets, four layers, four lessons — zero guessing.
A ticket shows a clean Open session, a named connector, but ConnectionSetupTime = 3,100 ms and dig fails on the connector host. Which router row do you follow?
dig on the connector host is the L4 DNS signature — frequently a file-permission issue on /etc/resolv.conf for the zscaler service account. Router row L4 → DNS & App Discovery.④ The 10-minute triage runbook
Put it all together as a timed, repeatable runbook. Run it top-down for one user, bottom-up for a crowd. Every box has a tool and a clock; the moment a check fails, you have your layer and your lesson — stop and fix.
Scope, then check the client (L1)
0–2 Is it one user or many? Pull the failing Diagnostics → User Activity row. The scope chooses your direction; the row chooses your layer.
2–3 (L1) On the laptop: ZCC > More > Connection Status — ZPA ON, tunnel up? No Diagnostics row at all = L1 → ZCC Troubleshooting; export logs.
Stop rule If L1 fails, you're done — fix the client, don't open the policy console.
Edge + connector (L2/L3), then reachability (L4)
3–5 (L2/L3) Did the session reach a healthy near Service Edge (Portal Diagnostics)? Is the connector Connected (journalctl -u zpa-connector, parent+child)? Empty Connector = L3 binding → Groups & Service Edge.
5–8 (L4) SSH to the named connector: dig app.corp.local then nc -vz <ip> 443. Named-but-slow / dig fails = L4 → DNS & App Discovery or Performance & MTU.
Stop rule First failure ends the run — note the layer and open its lesson.
Policy + identity (L5), then prove the fix
8–10 (L5) If everything below passed, the fault is policy: empty Policy + Close = L5. Run Access Policy simulation; check User Status / Authentication for the SAML/SCIM the IdP actually sent. → Access Policy lesson.
Verify Re-run the request. The SAME Diagnostics row must now read Open, a named connector, low ConnectionSetupTime, and the correct Policy.
Close Record which layer it was — over a month, your layer histogram tells you where to invest (a flood of L1s means a ZCC rollout problem, not a connector problem).
index=zpa sourcetype=zpa_user_activity
  Username="sneha.r@infosys.com" Host="sap.corp.local"
| table LogTimestamp, ConnectionStatus, Policy,
        Connector, ServerIP, ConnectionSetupTime, DoubleEncryption
ConnectionStatus  : Open
Policy            : Allow-SAP-Users
Connector         : connector-mumbai-01
ServerIP          : 10.50.7.40
ConnectionSetupTime: 38 ms
DoubleEncryption  : false
No row → L1 Client. Empty Connector + Close → L3 connector / binding. Open + high ConnectionSetupTime → L4 reachability (DNS / last-mile). Open + app-side TLS fail → L4 clientless / cert. Empty Policy + Close → L5 policy / identity.
During the runbook for ONE user, L1 passes (tunnel up), L2/L3 pass (connector named + green), but dig on the connector host fails to resolve the app. Where do you stop, and what's the fix path?
dig on the connector host is the L4 failure — you don't continue to L5. DNS resolution from the connector is the L4 signal, often a permissions issue on /etc/resolv.conf for the zscaler account.Symptom → layer → lesson (the router in flip form)
Layer: L1 Client. The request never entered ZPA — tunnel down / service off. Lesson: ZCC Troubleshooting. Check ZCC > Connection Status first.
Layer: L3 binding. Server group → connector group eligibility rejected all. Lesson: Groups & Service Edge / App Connector Troubleshooting.
Layer: L4 App/Net. High setup time / dig fails on the host. Lesson: DNS & App Discovery · Performance & MTU. Clientless TLS = Browser Access / PRA.
Layer: L5 Policy. No rule matched, or identity (SCIM/SAML) miss. Lesson: Access Policy · App Segments. Run policy simulation.
One-glance cheat-sheet — symptom → first check → lesson
🤖 Ask the AI Tutor
Tap any question — instant context-aware answer scoped to this lesson. No login, no waiting.
Pre-curated from Zscaler ZPA help docs + community Q&A. For live prod issues, paste your Diagnostics → User Activity row into chat.techclick.in.
📝 Wrap-up — six more
You've answered 4 inline. Six left. 70% (7 of 10) total marks the lesson complete on your profile. Tap Submit all answers at the end.
✍️ Explain it back (2 lines)
In your own words: what is the 5-layer method, and why does a green App Connector narrow the fault instead of closing the ticket? Type it, then reveal the expert version.
🧑🏫 Teach a friend
Tap to generate a one-liner you can paste to a teammate who's stuck.
📩 Quiz me again later
Opt in and we'll send 3 micro-questions on this playbook at Day 1, Day 7, and Day 30 — spaced recall locks it in.
Glossary — the words this playbook used
- 5-layer method — isolate which of L1 Client, L2 Edge/Broker, L3 Connector, L4 App/Network, L5 Policy failed, then fix that layer.
- L1 · Client (ZCC) — the Zscaler Client Connector on the device; must be enrolled with the ZPA service ON and the tunnel up.
- L2 · Edge / Broker — the Public/Private Service Edge that brokers the session; the device must reach a healthy, near one.
- L3 · Connector — the App Connector that actually opens the connection to the app; check health with
journalctl -u zpa-connector. - L4 · App / Network — DNS resolution + last-mile reachability from the connector host to the server (
dig/curl/nc). - L5 · Policy — the Access Policy rule (and the SAML/SCIM identity feeding it) that must ALLOW the request.
- Top-down vs bottom-up — walk L1→L5 for one user; walk L5/L4→L1 when everyone is hit at once.
- Diagnostics → User Activity — the per-request log whose wrong field names the failed layer.
- ConnectionSetupTime — time for the connector to set up to the server; a high value is the L4 reachability signal.
- Connector-green rule — a green connector proves only L3, so the fault (if any) is L1, L4, or L5.
📚 Sources
- Zscaler Help — Troubleshooting App Connectors & App Connector Managing & Troubleshooting (process health,
journalctl -u zpa-connector,fohh_connection_connected). help.zscaler.com/zpa - Zscaler Help — Accessing App Connector Status Diagnostics, About App Connector Status Log Fields, Accessing User Activity / User Status Diagnostics. help.zscaler.com/zpa
- Zscaler Help — Troubleshooting Private Service Edges & Understanding Private Access Session Status Codes (the L2 Edge/Broker layer). help.zscaler.com/zpa
- Zscaler Help — ZPA App Connector Troubleshooting Runbook (DNS resolution,
/etc/resolv.confpermissions for thezscaleruser). help.zscaler.com/troubleshooting-runbooks - Zscaler Help — Configuring Access Policies & Enabling SCIM for Identity Management (the L5 Policy + identity layer). help.zscaler.com/zpa
- Zscaler Academy — ZDTA (Digital Transformation Administrator) blueprint — Identity, Connectivity, Access Control service layers.
What's next?
This hub taught the method. Go deeper per layer using the router above, or read the sister lesson that organises the same fixes by symptom bucket (policy, mapping, certs, steering) — both reach the same lessons from different angles.
— Techclick Team