ip.zscaler.com answers “did this browser even hit a ZIA Public Service Edge?” Web Insights answers “was this internet/SaaS transaction Allowed, Blocked, or Cautioned — and which policy?” Tunnel Insights answers “is this site GRE / IPSec tunnel up?” ZPA User Activity answers “did this user reach this private app?” ZDX Hop View answers “where on the path did it get slow?” An Allow is not a healthy hop. A green Client Connector icon is not a Web row.
1. Why “is it working?” is five questions
Operators collapse five failures into one sentence. The laptop never reached Zscaler. The site GRE is down. Policy blocked the attachment. Access Policy never allowed the CRM. The hop between the Public Service Edge and Salesforce is dying. Those are five first clicks.
This page is the night-shift desk for proof. The factory taught the exchange. Lesson 13 teaches which log store to hunt. Here you learn the five tools you actually open, in order, when someone asks you to prove Zscaler is working.
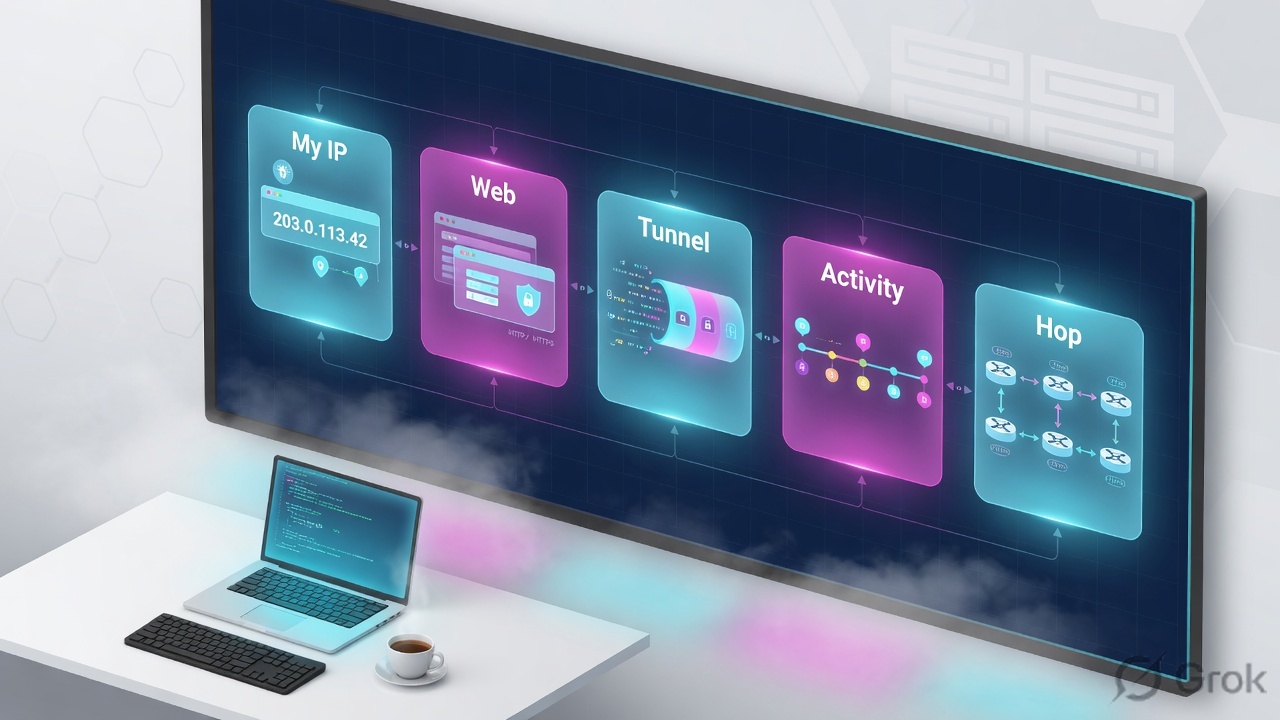
If they say “prove Zscaler is working,” do not say “I opened the Admin Portal.” Say: “I prove the wire with ip.zscaler.com, the transaction with Web Insights Policy Action, the site path with Tunnel Insights Tunnel Status, the private app with User Activity Connection Status, and the feel with a ZDX hop.”
2. Mental model — five proof tools
Memorise five named objects before you click. Each tool is allowed to prove one thing. Over-claiming a field is how you ship a bad change at 02:00.
1 · ip.zscaler.com
On the user’s device. Official My IP Address page. Proves whether this browser request arrived from a Zscaler IP. Does not prove policy, tunnel health, or hop latency.
2 · Web Insights
ZIA Logs → Insights → Web Insights → Logs. Proves one internet/SaaS transaction: Policy Action + Blocked Policy Name. Does not prove a private FQDN or a slow hop.
3 · Tunnel Insights
ZIA Logs → Insights → Tunnel Insights → Logs. Proves GRE / IPSec site-tunnel health: Tunnel Status, Tunnel Type, Event Reason. A Sample row with bytes is not a user allow.
4 · ZPA User Activity
ZPA Logs → Insights → Diagnostics, Log Type = User Activity. Proves the private-app session: Connection Status + Policy + Connector. Empty row → User Status first.
5 · ZDX hop
ZDX Users / Applications → Cloud Path → Hop View. Proves where latency or packet loss jumped. ZDX Score (0–100) is the pointer. The hop is the proof.
Hard words, once
ZEN / Public Service Edge = the ZIA node the traffic hit. Nanolog = the store Insights queries. LSS = ZPA’s streamer (not NSS). Hop View = Cloud Path visualisation (Help also documents Command Line View).
Read left → right. Each box is allowed one claim. If you cannot name the field, you are not proving — you are guessing.
I prove the wire, then the transaction, then the site tunnel, then the private session, then the hop. I do not change SSL, Access Policy, or a GRE peer until I can quote the field that made me do it.
3. Decision flow — ticket → first tool
Flowchart first. Do not open the policy editor until a diamond says so.
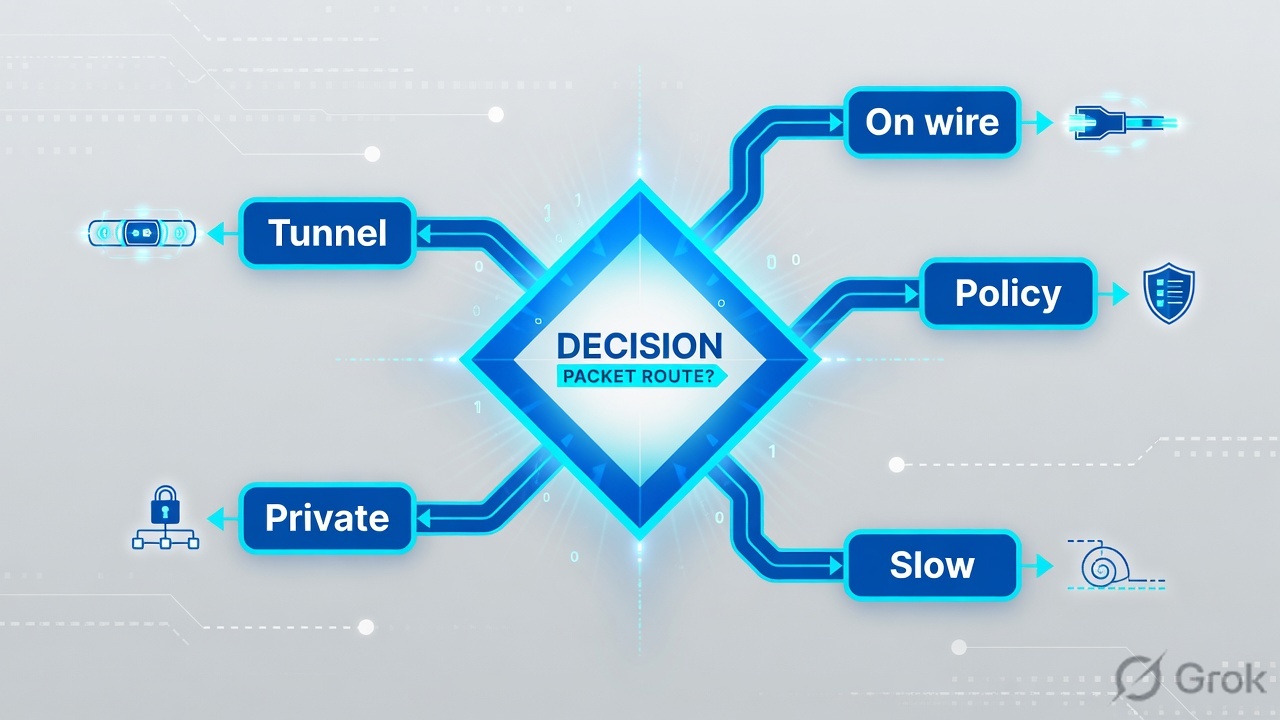
Read the diamond first. Private FQDN never starts in Web Insights. Allowed + slow never starts in policy. “Not a Zscaler IP” never starts in Blocked Policy Name.
4. How to choose — first tool + proof field
Print this next to the Admin Portal. If you cannot recite the proof field, you are not ready to change anything.
| If the ticket says… | First tool (official path) | Proof field | Do not open first |
|---|---|---|---|
| Laptop / hotel / “am I even in Zscaler?” | On the device: ip.zscaler.com (My IP Address) | Request arrived from a Zscaler IP — or the official “didn’t come from a Zscaler IP” line | A new URL Allow |
| One SaaS / URL blocked or cautioned after a policy change | ZIA Logs → Insights → Web Insights → Logs | Policy Action (Allowed / Blocked / Cautioned) + Blocked Policy Name |
ZDX Score, ZPA Diagnostics |
| Whole branch internet dead after a firewall / peer change | ZIA Logs → Insights → Tunnel Insights → Logs | Tunnel Status + Tunnel Type (GRE / IPSec IKEv1 / IKEv2) + Event Reason |
A Cloud App rule edit |
crm.internal.example / any private FQDN “no connection” |
ZPA Logs → Insights → Diagnostics · Log Type User Activity | Connection Status + Policy + Connector (session status codes live on this page) |
Web Insights URL Category |
| SaaS is slow; Web Insights already shows Allowed | ZDX Users / Applications → Cloud Path → Hop View | Per-hop latency and packet loss (Score 0–100 is the pointer) |
A new URL Block |
Zscaler Help on verifying forwarding: the My IP Address service at ip.zscaler.com might not recognize IPv6 traffic that is already passing through the Zscaler cloud. If the laptop is IPv6-first and the page looks “off-cloud,” confirm with a Web Insights row for that user in the same minute — do not rip Z-Tunnel from one IPv6 false negative.
5. Runbook Side A → B → C
Side A proves the ZIA wire and the internet/SaaS transaction. Side B proves the private-app session. Side C proves the path the user felt. On a messy Sev-2, do them in this order until a field lights up.
Side A — Wire, Web, Tunnel (ZIA)
-
Prove the browser hit a Public Service Edge
On the user’s device open https://ip.zscaler.com. Official article: Verifying a User’s Traffic is Being Forwarded to the Zscaler Service. If the page says the request did not come from a Zscaler IP, stop. There is no
Policy Actionto chase. Fix PAC / Z-Tunnel 2.0 / known-location GRE, then reload the page. -
Open Web Insights, not the policy editor
Path: Logs → Insights → Web Insights → Logs (About Insights; NSS mapping uses the same path. Older tenants may still say Analytics → Insights Logs → Web). Filter User + the UTC window on the ticket. Add URL or Cloud Application if you already know the destination.
-
Read the two columns that close a policy ticket
Policy Action— Allowed, Blocked, or Cautioned.Blocked Policy Name— which policy took the action. AddURL CategoryandCloud Applicationso you know what the engine thought it saw. Source: Web Insights Logs: Columns. -
If Web is empty for a whole site, switch Insights type
Same Insights family: Tunnel Insights → Logs. Filter Location + time. Read
Log Type= Tunnel Event (status change) or Sample (bytes in the one-minute interval). QuoteTunnel Status,Tunnel Type,Tunnel Source IP,Tunnel Destination IP(the VIP), andEvent Reason(PSK mismatch, DPD timeout, invalid proposal, lifetime expired). Source: Tunnel Insights Logs: Columns.
User device / browser / ip.zscaler.com
You are going through the Zscaler service
The request received from you didn't come from a Zscaler IP
therefore you are not going through the Zscaler proxy service.
Source: Zscaler Help — Verifying a User’s Traffic is Being Forwarded to the Zscaler Service; live service at ip.zscaler.com. Cloud / ZEN strings above are lab labels. Training mock · not live.
Logs / Insights / Web Insights / Logs
Web Insights Logs
| User | URL / App | URL Category | Policy Action | Blocked Policy Name |
|---|---|---|---|---|
| priya@lab.example | outlook.office.com | Webmail | Allowed | — |
| priya@lab.example | attachment.outlook.office.com | Webmail | Blocked | DLP-PII-OWA-Attach |
Source: Zscaler Help — About Insights; About Insights Logs; Web Insights Logs: Columns (Policy Action, Blocked Policy Name, URL Category, Cloud Application). Lab identities only.
Side B — ZPA User Activity (private-app session)
-
Open User Activity, not Web Insights
Path: Logs → Insights → Diagnostics. From Log Type, select User Activity. Official: Accessing User Activity Diagnostics. Filter Username + Application Segment + time. A private FQDN will not appear as a URL Category hit in ZIA.
-
Read Connection Status, then Policy, then Connector
Session status codes appear on the User Activity Diagnostics page (Understanding Private Access Session Status Codes). LSS User Activity fields for the same session include
ConnectionStatus,Policy,Connector,Application,Server,InternalReason. -
If there is no User Activity row, switch to User Status
Same Diagnostics page, Log Type = User Status. That answers “did Client Connector attach to a ZPA Service Edge?” Status codes include Authenticated, Authentication Failed, Disconnected. It does not answer “did CRM load.”
Path:            Logs → Insights → Diagnostics
Log Type:        User Activity
Username:        contractor@lab.example
Application:     CRM-Prod
Quote:           Connection Status + Policy + Connector + Server
If empty row:    Log Type = User Status  (Authenticated / Authentication Failed)
Side C — ZDX hop (the path the user felt)
-
Confirm the app is actually probed
ZDX does not invent Cloud Path for every SaaS. If Salesforce has no Cloud Path probe, Hop View is empty and you cannot prove a hop. Inventory the top user-facing apps first (Help: Configuring Zscaler Managed / Hosted Probes).
-
Open Cloud Path → Hop View
Official: Evaluating the Cloud Path. ZDX traces the end-to-end path and measures latency, packet loss, and jitter across hops. Hop View and Command Line View both exist; errors show as icons (Cloud Path Errors). Quote the hop, not the headline score.
-
Treat Score as a pointer
Understanding the ZDX Score: 0 (lowest) to 100 (highest). Score uses Cloud Path probe metrics — end-to-end latency, packet loss, hops. A 42 versus peers at 81 is a gap. It is not a URL-rule change and it is not a tenant Sev-1 by itself.
- Side A wire: ip.zscaler.com shows the request came from a Zscaler IP (IPv4). Side A policy: Web row names
Policy Action+Blocked Policy Name. - Side A tunnel: Tunnel Event shows
Tunnel Statusup for that Location at the same minute the site recovered. - Side B: User Activity
Connection Statussucceeds on the intended Policy + Connector. - Side C: Hop View names the hop; Score recovers after the path change, without a new URL rule.
6. Five tickets as full stories
These five land every quarter. Memorise first tool + proof field. Times and identities below are lab-only.
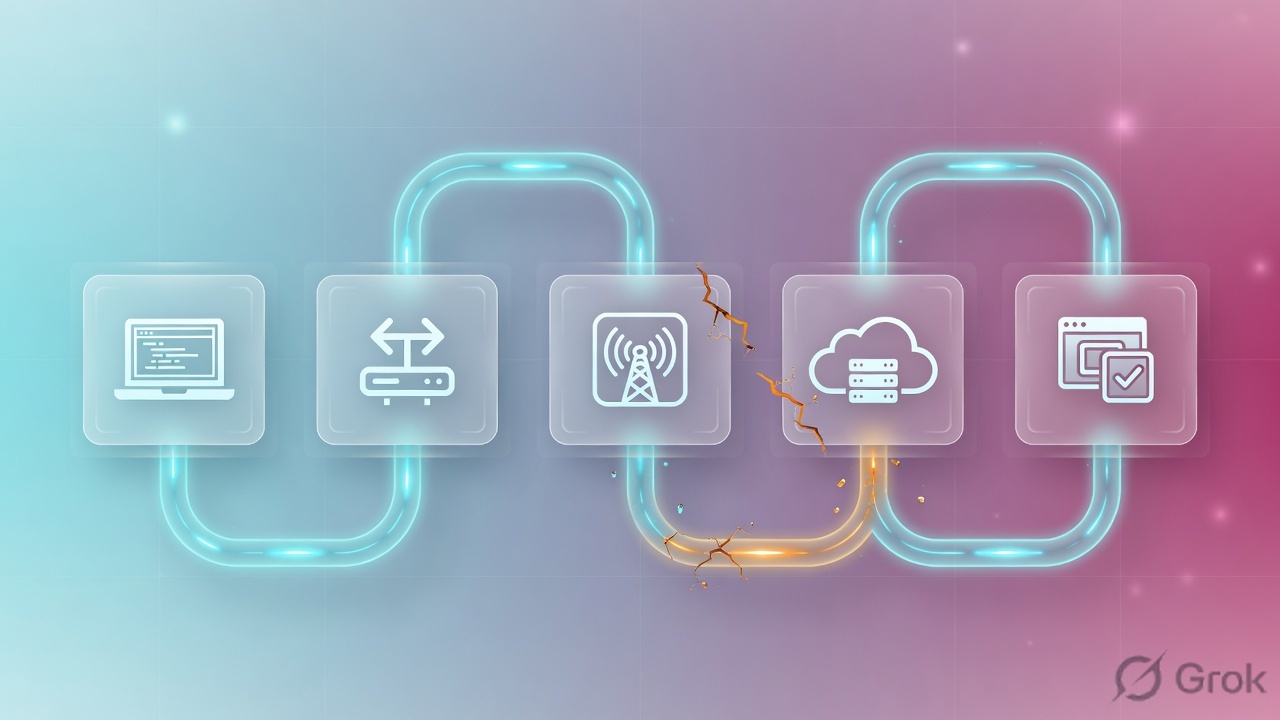
| Ticket | Symptom | First tool | Proof field |
|---|---|---|---|
| ZEVD-01 | WFH laptop: “internet is broken, Zscaler is down” | ip.zscaler.com | Request from a Zscaler IP — or the official off-cloud sentence |
| ZEVD-02 | After a new DLP rule, Outlook Web loads, attachments fail | Web Insights Logs | Policy Action = Blocked · Blocked Policy Name = the DLP rule |
| ZEVD-03 | Branch internet dead since a 02:00 firewall change; Web empty | Tunnel Insights Logs | Tunnel Status + Event Reason + Location / VIP |
| ZEVD-04 | crm.internal.example — Client Connector “no connection” | ZPA User Activity | Connection Status + Policy + Connector |
| ZEVD-05 | Salesforce slow for one user; Insights already Allowed | ZDX Cloud Path → Hop View | Hop with jump in latency / packet loss |
ZEVD-01 — Prove the wire (ip.zscaler.com)
01:42 · P2. Priya on a hotel network. Client Connector icon looks green-ish on a phone photo. L1 already drafted a new URL Allow.
First tool: on her browser, https://ip.zscaler.com.
If off-cloud: the page states the request did not come from a Zscaler IP, so she is not going through the Zscaler proxy service. Quote that sentence. Next check is forwarding — PAC returning DIRECT, Z-Tunnel down, or trusted-network disable — not Web Insights policy.
If on-cloud: the request arrived from a Zscaler IP. Now you are allowed to open Web Insights for her user and the failing URL. The My IP page is not Policy Action.
Do not trust a colleague’s ip.zscaler.com from a different network. The proof is on the failing device. IPv6-only paths can lie — confirm with a Web row in the same minute.
ZEVD-02 — Prove the SaaS transaction (Web Insights)
02:05 · P2. Outlook on the Web opens. Attachments fail after last night’s DLP ship. Someone wants “another Allow for outlook.office.com.”
First tool: Logs → Insights → Web Insights → Logs. Filter User = priya@lab.example, Cloud Application = Microsoft Exchange Online, last hour.
Proof field: page host Policy Action = Allowed; attachment host Policy Action = Blocked and Blocked Policy Name = DLP-PII-OWA-Attach. That name is the ticket. Change that one rule — or narrow its DLP engine — Activate, then re-read the same two columns.
I would not add a second URL Allow. I would quote Blocked Policy Name on the attachment transaction. Activate is not proof until the same filter returns Allowed.
ZEVD-03 — Prove the site tunnel (Tunnel Insights)
02:20 · P1. Pune branch: every desk lost internet after a 02:00 firewall change. Web Insights for that Location is empty. L1 wants a Force re-auth.
First tool: Logs → Insights → Tunnel Insights → Logs. Filter Location + 01:50–02:20 UTC. Look at Log Type = Tunnel Event, not just Sample.
Proof field: Tunnel Type = GRE (or IPSec IKEv2), Tunnel Status flipped, Event Reason = DPD timeout / PSK mismatch / invalid proposal, Tunnel Destination IP = the VIP you think you still allow. Simultaneous 02:00 death is almost never “everyone’s SAML cookie expired together” — cookies stagger.
Empty Web is the clue the tunnel never landed. Quote Tunnel Event + Event Reason. Restore 443 / protocol 47 / UDP 500+4500 to the VIP, then wait for Tunnel Status up and the first Web row. Do not Activate a Cloud App rule on an empty log.
ZEVD-04 — Prove the private-app session (User Activity)
02:40 · P2. Contractor cannot open crm.internal.example. Application Segment is Enabled. L1 wants the App Connectors restarted.
First tool: ZPA Logs → Insights → Diagnostics · Log Type User Activity. Filter username + CRM-Prod + last 30 minutes.
Proof field: Connection Status + Policy + Connector. Enabled is the object. User Activity is the decision. If the row is empty, switch Log Type to User Status — Authentication Failed means the device never built a ZPA session (token, posture, or Client Connector), so a Connector restart will not help.
Web Insights will not show crm.internal.example as a URL Category hit. Restarting a healthy Connector pair is change-control, not isolate.
ZEVD-05 — Prove the hop (ZDX Hop View)
03:00 · P3. Salesforce “the cloud is slow” for one laptop. Web Insights Policy Action is already Allowed. Someone typed Sev-1 in the channel.
First tool: ZDX → that user → Salesforce → Cloud Path → Hop View.
Proof field: the hop whose latency / packet loss jumped — often ISP → Public Service Edge, or Edge → Salesforce — plus the path-change time. Score 42 versus peers 81 is the pointer. It is not a URL Allow and it is not a tenant outage by itself.
I would leave policy alone. I would paste the hop row and the peer gap. If hops 1–2 (device → gateway → ISP) are clean and the Edge → app hop is not, that is peering or the SaaS — not a ZIA rule.
7. Traps + close-the-ticket proof
| You see | Weak close | Strong close |
|---|---|---|
| ip.zscaler.com off-cloud | “Zscaler is down” / new URL Allow | Quote the official off-cloud sentence; fix forwarding; reload My IP |
| ip.zscaler.com on-cloud, still failing | “Zscaler is fine” | You only proved the wire. Open Web Insights for that URL. |
| Allow + inspect / Allowed | “Zscaler is working” | Allowed is a verdict, not a hop. If they said slow → ZDX Hop View. |
| Empty Web Insights | A Cloud App rule must have blocked everything | ip.zscaler.com or Tunnel Insights first |
| Tunnel Sample still has bytes | “Tunnel is fine” | Read Tunnel Event + Tunnel Status. Sample is a one-minute counter. |
| ZPA segment Enabled | Restart both Connectors | User Activity Connection Status + Policy + Connector |
| ZDX Score 42 | Tenant Sev-1 / new Allow | Hop latency / loss + path-change + peer compare |
| IPv6 My IP looks off-cloud | Rip Z-Tunnel | Official IPv6 caveat. Confirm with a Web row in the same minute. |
- UTC window written next to the tool you opened.
- Wire proved on the failing device (
ip.zscaler.com) when the ticket is “am I in Zscaler?” - One transaction quoted: Web
Policy Action+Blocked Policy Name, or Tunnel EventTunnel Status, or User ActivityConnection Status, or one ZDX hop. - Next tool named — or change-control owner named. No Activate without residual control.
- Peer or second host compared when you claim “not a tenant outage.”
- IPv6 My IP not used as the only off-cloud proof.
I name the question, then the first tool, then one official field. ip.zscaler.com proves the wire. Web Insights proves the SaaS verdict. Tunnel Insights proves the site GRE/IPSec. User Activity proves the private session. ZDX hop proves the feel. I do not change SSL, Access Policy, or a GRE peer until that field is on the ticket. Deeper log-store map: Lesson 13 · which log answers which ticket. Factory model: exchange factory.
Knowledge check
Six night-shift judgments. Each maps to a first tool or a proof field. Check answers, then Reset if you picked the wrong surface.
Sources
- Zscaler Help — Verifying a User’s Traffic is Being Forwarded to the Zscaler Service (
ip.zscaler.comMy IP Address; IPv6 caveat) - ip.zscaler.com — My IP Address (live check; off-cloud wording)
- Zscaler Help — About Insights (Logs → Insights)
- Zscaler Help — About Insights Logs (Web, Tunnel, and sibling types)
- Zscaler Help — Web Insights Logs: Columns (
Policy Action,Blocked Policy Name,URL Category,Cloud Application) - Zscaler Help — Web Insights Logs: Filters
- Zscaler Help — NSS Feed Output Format: Web Logs (maps fields to Logs → Insights → Web Insights → Logs)
- Zscaler Help — Tunnel Insights Logs: Columns (
Tunnel Status,Tunnel Type,Event Reason, Log Type Sample / Phase 1 / Phase 2 / Tunnel Event) - Zscaler Help — Tunnel Insights Logs: Filters
- Zscaler Help — Configuring GRE Tunnels (monitor in Tunnel Insights)
- Zscaler Help — Configuring an IPSec VPN Tunnel (Logs → Insights → Internet & SaaS — Tunnel Insights)
- Zscaler Help — Accessing User Activity Diagnostics (Logs → Insights → Diagnostics · Log Type: User Activity)
- Zscaler Help — Accessing User Status Diagnostics
- Zscaler Help — Understanding Private Access Session Status Codes
- Zscaler Help — Understanding User Activity Log Fields (LSS:
ConnectionStatus,Policy,Connector,InternalReason) - Zscaler Help — Evaluating the Cloud Path (Hop View; latency, packet loss, jitter)
- Zscaler Help — Cloud Path Errors
- Zscaler Help — Understanding the ZDX Score (0–100; latency, packet loss, hops)
- Zscaler Help — Evaluating User Details
Related: Blog 1 · Zscaler exchange factory · Lesson 13 · which log answers which ticket · ZIA authentication · ZIA GRE + IPSec · ZIA traffic flow · Zscaler practice dashboard