Web Insights answers “was this internet/SaaS transaction allowed, blocked, or cautioned, and which policy?” — Policy Action + Blocked Policy Name. Nanolog is the cloud store those rows come from; NSS streams the same fields to your SIEM when Insights retention is not enough. ZPA Diagnostics → User Activity answers “did this user reach this private app?” — Connection Status, Policy, Connector. ZDX Cloud Path → Hop View answers “where on the path did it get slow?” — hop latency and packet loss. An Allow in Insights is not a healthy path.
1. Why four surfaces exist
A block page, a spinner, a slow SaaS tab, and “it worked last quarter” look the same in Slack. They are four different questions. Zscaler ships four surfaces so you do not answer a latency ticket with a URL rule change.
Web Insights is the in-tenant transaction log for internet and SaaS that went through ZIA. Nanolog is the backend those logs live in; Insights is the GUI over it, and NSS is the pipe out of it. ZPA diagnostics is not a web log — it is the private-app session decision. ZDX is not a policy engine — it measures the hop path the user felt.
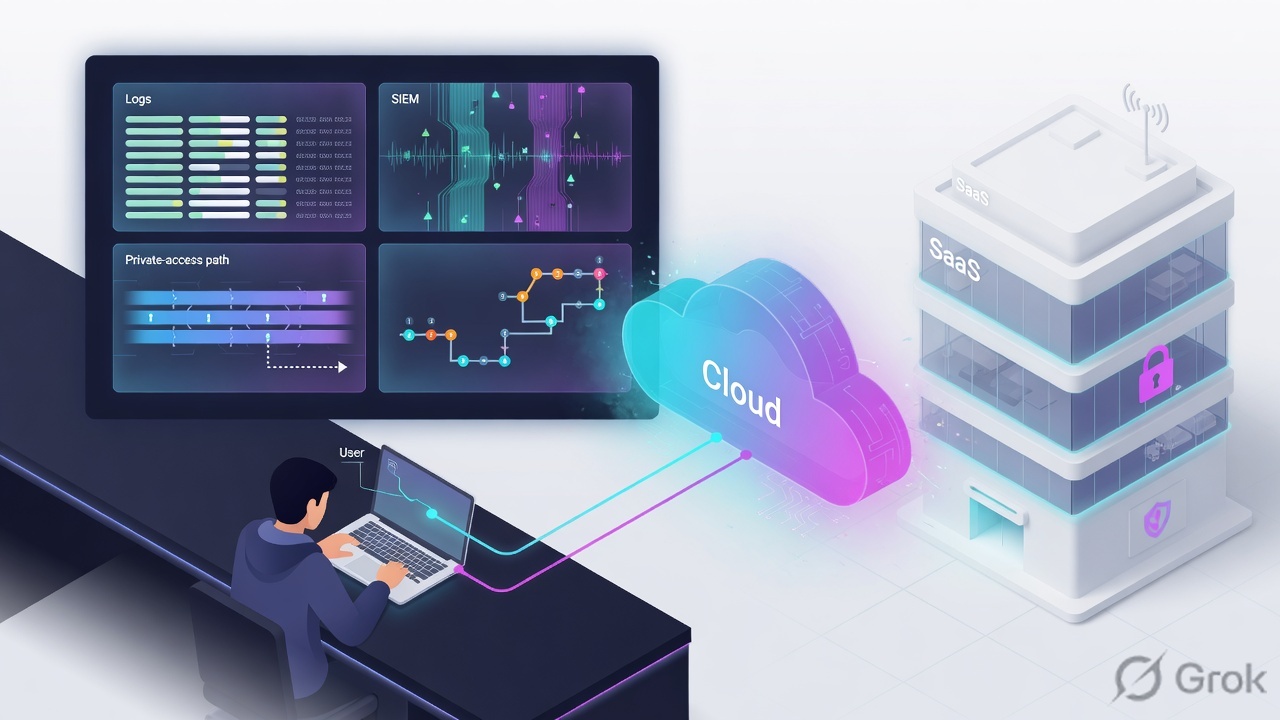
If they say “check the logs,” name the surface. “I opened Insights” is incomplete. Say: “If Policy Action is Allowed and the user still says slow, I leave policy alone and open ZDX Cloud Path Hop View.”
2. Mental model — Insights, Nanolog, Diagnostics, ZDX
Memorise four named objects before you open any Admin Portal. Every ticket in this lesson maps back to one of them.
Web Insights Logs
ZIA Admin → Analytics → Insights Logs → Web (Help title: Web Insights Logs). Live GUI over Nanolog. Columns that close tickets: Policy Action, Blocked Policy Name, URL Category, Cloud Application.
Nanolog + NSS
Nanolog is the Zscaler cloud log cluster. Nanolog Streaming Service (NSS) (Administration → Nanolog Streaming Service) streams those records to Splunk / Sentinel / QRadar / Elastic. Use it when Insights retention is too short or you must join Zscaler with EDR.
ZPA User Activity diagnostics
ZPA Admin → Logs → Insights → Diagnostics, Log Type = User Activity. This is the private-app session, not a URL. Proof: Connection Status, Application Segment, Policy, Connector.
ZDX Cloud Path / Hop View
ZDX Admin → Users (or Applications) → Cloud Path. Hop View and Command Line View show per-hop latency and packet loss. A ZDX Score is 0–100 (higher is better). The score drop is the alert; the hop is the proof.
Read left → right. Insights and NSS share a store. ZPA and ZDX are different questions, even when the user used the same Client Connector.
3. Decision flow — ticket → first tool
Flowchart first. Do not open policy until the diamond says so.
Read the diamond first. Private FQDN never starts in Web Insights. Allowed + slow never starts in policy. Empty Web log starts in Tunnel Insights.
4. How to choose — field-level map
If you can recite this table, the rest of the lesson is practice.
| If the ticket says… | First tool (official path) | Proof field | Do not open first |
|---|---|---|---|
| Site / SaaS blocked or caution EUN after a policy change | ZIA Analytics → Insights Logs → Web | Policy Action (Allowed / Blocked / Caution) + Blocked Policy Name | ZDX Score, ZPA Diagnostics |
| SaaS is slow; Insights already shows Allowed | ZDX Users / Applications → Cloud Path → Hop View | Per-hop latency and packet loss; ZDX Score vs that user’s baseline | A new URL Block |
jira.corp.internal / any private FQDN “no connection” | ZPA Logs → Insights → Diagnostics · Log Type User Activity | Connection Status + Policy + Connector (+ Application Segment) | Web Insights URL Category |
| Auditor: 12 months of DLP / web by user | Administration → Nanolog Streaming Service → SIEM search | NSS Web feed fields streamed from Nanolog (user / login, action, DLP engine / rule labels) | Insights GUI (retention ages out) |
| Client Connector red, whole site, no Web rows | ZIA Analytics → Insights Logs → Tunnel | Client Tunnel IP, Zscaler Client Connector Tunnel Version, up/down time | A Cloud App rule edit |
Nanolog is the store. Insights Logs is the GUI that queries it. NSS is the streamer out of it. LSS is the ZPA-side log streamer (Log Streaming Service) — do not call ZPA’s feed “NSS.” Cloud Path is the ZDX probe that walks hops. Hop View is the visualisation of that probe (Help also documents a Command Line View).
5. Runbook Side A → B → C
Side A is the ZIA live log. Side B is the ZPA session. Side C is experience + long-term store. Do them in this order on a messy Sev-2 when you do not yet know the layer.
Side A — ZIA Insights Logs (live policy proof)
-
Open Web Insights, not the policy editor
Path: Analytics → Insights Logs → Web. Official page title is Web Insights Logs. Filter User + time window that covers the ticket. Add URL or Cloud Application if you already know the destination.
-
Read the three columns that close a policy ticket
Policy Action— Allowed, Blocked, or Cautioned.Blocked Policy Name— which policy took the action.URL CategoryandCloud Application(plus Cloud Application Class) — what the engine thought it saw. Source: Web Insights Logs: Columns. -
If there are zero Web rows, switch type — do not invent a URL rule
Same Insights Logs page has sibling types documented from About Insights Logs: Firewall, DNS, Tunnel, Mobile, and others. Site-wide Client Connector red belongs in Tunnel Insights Logs (
Client Tunnel IP,Zscaler Client Connector Tunnel Version).
Analytics / Insights Logs / Web
Web Insights Logs
| User | URL / App | URL Category | Policy Action | Blocked Policy Name |
|---|---|---|---|---|
| priya@lab.example | outlook.office.com | Webmail | Allowed | — |
| priya@lab.example | attachment.outlook.office.com | Webmail | Blocked | DLP-PII-OWA-Attach |
Source: Zscaler Help — About Insights Logs; Web Insights Logs: Columns (Policy Action, Blocked Policy Name, URL Category, Cloud Application). Lab identities only.
Side B — ZPA Diagnostics (private-app session)
-
Open User Activity, not Web Insights
Path: Logs → Insights → Diagnostics. From Log Type, select User Activity. Official article: Accessing User Activity Diagnostics. Filter Username + Application Segment + time.
-
Read Connection Status, then Policy, then Connector
Help documents Connection: Status as a filter on this page. Session status codes live on Understanding Private Access Session Status Codes. LSS User Activity fields (same session, streamed) include
ConnectionStatus,Policy,Connector,Application,AppGroup,Server,InternalReason. -
If there is no User Activity row, check User Status
Same Diagnostics page, Log Type = User Status. That answers “did Client Connector even attach to a ZPA Service Edge?” — not “did Jira load.” Posture misses show on the user-status side (LSS:
PosturesMiss).
Log Type:        User Activity
Username:        contractor@lab.example
Application:     Jira-Prod
ConnectionStatus + Policy + Connector + Server
InternalReason   ← why the broker refused, if it refused
Side C — ZDX hop path + Nanolog/NSS
-
Confirm the app is actually probed
ZDX does not invent data for every SaaS. If Workday has no probe, the Users dashboard will not grow a Cloud Path. Inventory the top user-facing apps and attach Web / Cloud Path probes (Help: Configuring Zscaler Managed Probes — includes a Hop Count setting).
-
Open Cloud Path → Hop View
Official: Evaluating the Cloud Path. ZDX traces the end-to-end path and measures latency and packet loss between hops. Hop View and Command Line View both exist; errors also appear as icons (Cloud Path Errors). The bad hop is the proof field — not the headline ZDX Score.
-
If the question is “show me last year,” leave the GUI
Path: Administration → Nanolog Streaming Service → NSS Feed (Web, Firewall, DNS, Tunnel, and the rest). Official: Understanding Nanolog Streaming Service; NSS Feed Output Format: Web Logs. Insights is still querying Nanolog — it just will not keep the row as long as your SIEM will.
Users / priya@lab.example / Salesforce / Cloud Path
Cloud Path · Hop View
| Hop | Segment | Latency | Packet loss |
|---|---|---|---|
| 1 | Endpoint → local gateway | 4 ms | 0% |
| 2 | ISP | 12 ms | 0% |
| 3 | ZIA Public Service Edge | 18 ms | 0% |
| 4 | PSE → Salesforce edge | 480 ms | 8% |
Source: Zscaler Help — Evaluating the Cloud Path; Cloud Path Errors; Understanding the ZDX Score. Hop numbers are a lab story, not a live tenant. Training mock · not live.
6. Five tickets — first tool + proof
These five land every quarter. Memorise first tool + proof field. The runbook above is how you walk them.
| Ticket | Symptom | First tool | Proof field |
|---|---|---|---|
| INC-4812 | After a new DLP rule, Outlook Web loads but attachments fail | Analytics → Insights Logs → Web | Policy Action = Blocked · Blocked Policy Name = the DLP rule |
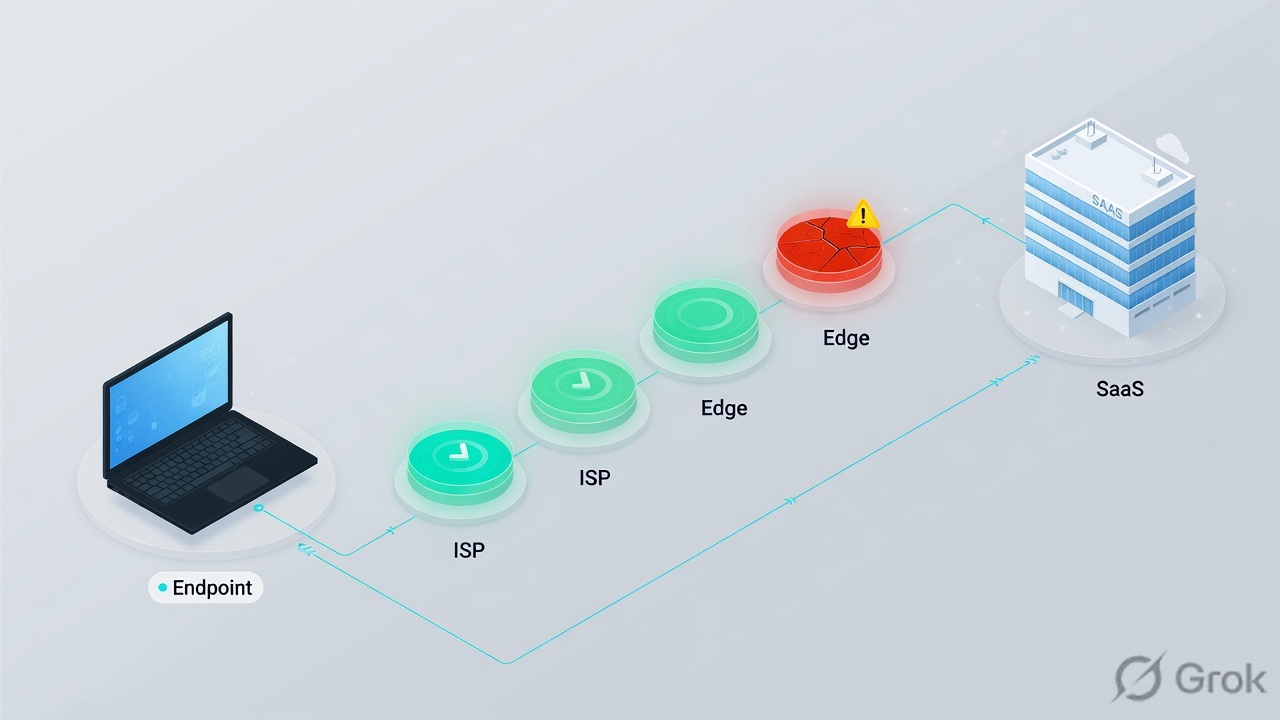
| INC-4813 | Salesforce slow for all of APAC; Insights shows Allowed | ZDX → Cloud Path → Hop View | Hop with jump in latency / packet loss (often PSE → SaaS, not the laptop) |
| INC-4814 | jira.corp.internal — Client Connector “no connection” | ZPA Logs → Insights → Diagnostics → User Activity | Connection Status + Policy + Connector |
| INC-4815 | Auditor: “All DLP triggers for PII, by user, last 12 months” | Nanolog via NSS → SIEM | NSS Web log user / action / DLP engine fields over SIEM retention |
| INC-4816 | Branch: Client Connector red on every laptop since 02:00; no Web rows | Analytics → Insights Logs → Tunnel | Client Tunnel IP + tunnel up/down time; then confirm 443 egress to Zscaler |
INC-4812 — OWA attachments, new DLP
Web Insights, not ZPA. Outlook on the Web is internet/SaaS. Filter User + Cloud Application (or URL containing outlook.office.com) + last hour. If the page itself is Allowed and the attachment host is Blocked, Blocked Policy Name is the ticket. Change that one rule — or narrow its DLP engine — Activate, then re-read the same three columns.
INC-4813 — Salesforce slow, Insights Allowed
Do not add a URL Allow. Policy already allowed it. Open ZDX for Salesforce, APAC users, Cloud Path. If hops 1–3 (endpoint → ISP → Public Service Edge) are baseline and hop 4 (edge → Salesforce) spikes, that is a path/peering problem. Check Zscaler Trust / status, then a temporary forwarding change only if your runbook already has a known-good failover. Close with the hop row, not a policy screenshot.
INC-4814 — Jira via ZPA
Web Insights will not show jira.corp.internal as a URL category hit. User Activity tells you whether Access Policy matched, which Connector was chosen, and whether Connection Status failed. If there is no User Activity row, User Status tells you the device never built a ZPA session (token, posture, or Client Connector). After you edit a policy, re-query User Activity — Activate is not proof.
INC-4815 — Twelve-month DLP
Insights retention is SKU-dependent and ages out. That is why NSS exists. Administration → Nanolog Streaming Service → a Web NSS feed into the SIEM, with parsers actually installed. If the feed is up but no CIM / content pack is mapped, you have raw syslog and no audit answer. Do not promise Insights will cover a year.
INC-4816 — Site-wide tunnel red
Zero Web rows is data. Open Tunnel Insights for that location and time. Simultaneous failure at 02:00 after a firewall change is almost never “everyone’s SAML token expired together” — tokens stagger. Confirm outbound 443 to Zscaler Public Service Edges, then Client Connector version. PAC-only users with a broken PAC return DIRECT and also vanish from Insights; tunneled Client Connector users would still appear. That split is the PAC tell.
- 4812: Web row names
DLP-PII-OWA-Attach(or whatever you wrote) as Blocked Policy Name. - 4813: Hop View names the hop; ZDX Score recovers after the path change, without a new URL rule.
- 4814: User Activity
Connection Statussucceeds on the intended Policy + Connector. - 4815: SIEM search over 12 months returns the NSS Web fields, not an Insights “no data” pane.
- 4816: Tunnel Insights shows the tunnel up at the same timestamp the icon turns green.
7. Traps + close-the-ticket proof

| Trap | What it looks like | First check |
|---|---|---|
| Treating Allowed as healthy | User says slow; you keep editing URL rules | Policy Action = Allowed → leave policy. ZDX Hop View. |
| Web Insights for a private FQDN | Empty Web log, Jira still dead | ZPA Diagnostics · User Activity. |
| ZDX deployed, no probe for that app | Score pane says no data while Slack burns | Configuration → probes. Workday / custom apps are opt-in. |
| Trusting ZDX Score without Hop View | Score is low; you blame ZIA | Score is a rollup. The hop (or device CPU / Wi-Fi) is the cause. |
| Calling ZPA’s stream “NSS” | SIEM has ZIA Web and nothing for ZPA | ZIA = NSS. ZPA = LSS (Log Streaming Service). |
| NSS ingest, no parsers | Auditor ask fails even though EPS is healthy | Install the vendor content pack; search the official Web feed fields. |
| Tunnel-down hunted in Web | No rows, you assume “policy dropped everything” | Tunnel Insights. Then 443 egress / PAC / trusted-network disable. |
| Activate without a re-query | ZPA policy “fixed,” user still blocked | Re-run User Activity. A higher-priority Policy or PosturesMiss may still win. |
- Web Insights saved filter (User + last 1 hour + Policy Action = Blocked) returns rows.
- Tunnel Insights shows current Client Connector tunnels for a known location.
- One ZPA User Activity query for a known healthy app returns Connection Status success + the expected Connector.
- SIEM: events from the NSS Web feed in the last 15 minutes > 0. Alert if that count is 0.
- ZDX: Salesforce / Teams / your top-5 apps each have a Cloud Path probe; Hop View is not empty.
Insights tells me the verdict. Nanolog plus NSS keeps the verdict. ZPA Diagnostics names the Connector. ZDX names the hop. I do not change a URL rule because a hop died.
Knowledge check
Six judgment items. Each one maps to a ticket or a trap. Check answers, then Reset if you picked the wrong surface.
Sources
- Zscaler Help — About Insights Logs (Analytics → Insights Logs; Web, Firewall, DNS, Tunnel, and sibling types)
- Zscaler Help — Web Insights Logs: Columns (
Policy Action,Blocked Policy Name,URL Category,Cloud Application,Cloud Application Class) - Zscaler Help — Web Insights Logs: Filters
- Zscaler Help — Firewall Insights Logs: Columns (
Action,Rule Name,Client Tunnel IP,Zscaler Client Connector Tunnel Version) - Zscaler Help — Tunnel Insights Logs: Columns
- Zscaler Help — Understanding Nanolog Streaming Service
- Zscaler Help — NSS Feed Output Format: Web Logs
- Zscaler Help — Adding TCP NSS Feeds (Administration → Nanolog Streaming Service)
- Zscaler Help — Accessing User Activity Diagnostics (Logs → Insights → Diagnostics · Log Type: User Activity)
- Zscaler Help — Accessing User Status Diagnostics
- Zscaler Help — Understanding Private Access Session Status Codes
- Zscaler Help — About User Activity Log Fields / LSS format (
ConnectionStatus,Policy,Connector,InternalReason) - Zscaler Help — Evaluating the Cloud Path (Hop View, latency, packet loss)
- Zscaler Help — Cloud Path Errors
- Zscaler Help — Understanding the ZDX Score
- Zscaler Help — ZDX troubleshooting / remediation
- Zscaler Help — Configuring Zscaler Managed / Hosted Probes (Hop Count)
Related: Lesson 12 · Isolation + SIPA · Lesson 5 · URL + Cloud App (Web Insights proof) · Lesson 9 · ZPA architecture · Lesson 10 · ZPA Connectors · Lesson 14 · ZDTA + interview · Authentication (identity before logs)