User Activity answers “did this user reach this private app?” — quote Connection Status + Policy + Connector. Empty row → same page, Log Type User Status (Authenticated / Authentication Failed / Disconnected). App Connector Status answers “is a healthy member in the bound group?” Access Policy is default-deny, first-match — Enabled on the segment is not an Allow. Browser Access is a different Client Type; posture rules will not match it. ZDX Hop View answers “where did an already-allowed session get slow?” A green connector tile is not a User Activity row.
1. Why a green connector is not the ticket
Operators collapse five ZPA failures into one sentence: “HR is down, restart the connectors.” The laptop never attached to a Service Edge. Access Policy never allowed the contractor. The Server Group points at a different App Connector Group. The connector is up and the application health is Down. The user is on Browser Access with a posture rule that can never match. Those are five first clicks.
This page is the night-shift ladder for one private-app transaction. Lesson 13 taught which log store to hunt. The evidence desk taught five proof tools across ZIA and ZPA. Here you stay inside ZPA and ZDX and you refuse to name an owner until a named field on a UTC timestamp says so.
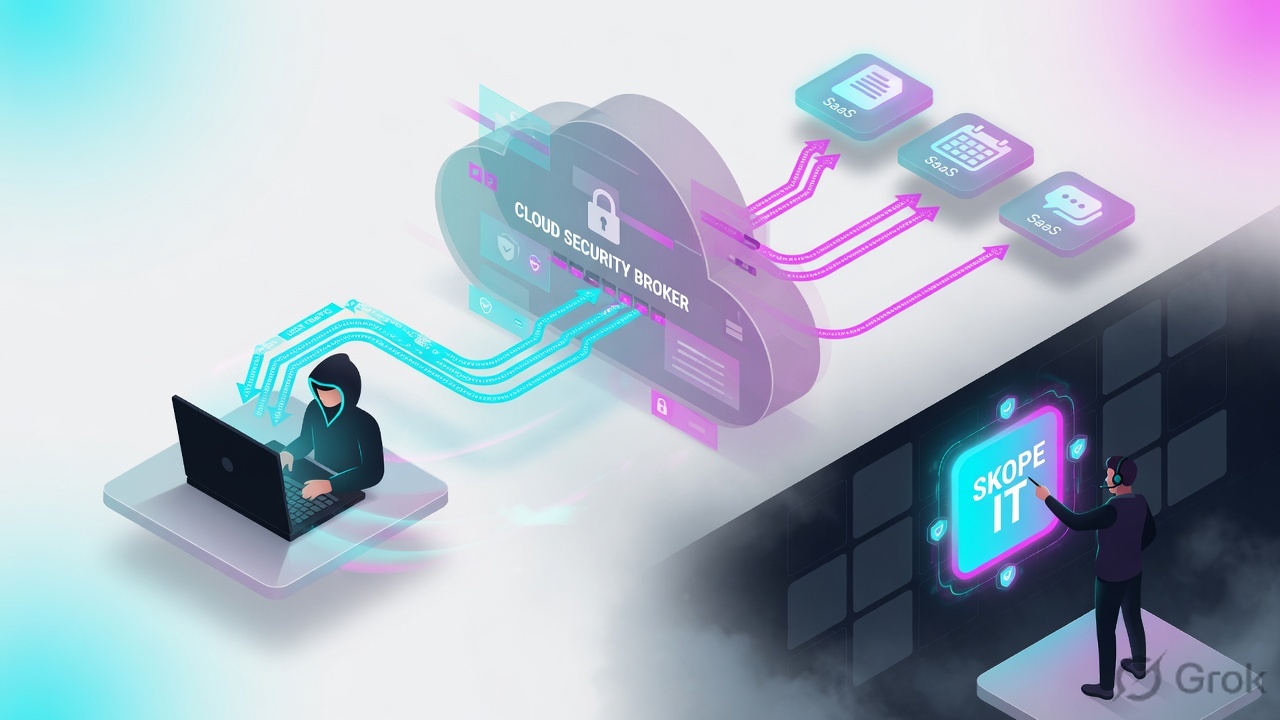
If they say “HR is down, what do you check?”, do not say “I opened the App Connectors page.” Say: “I open User Activity and quote Connection Status, Policy, and Connector. Empty row → User Status. Policy deny → Access Policy first-match. Connector ID 0 → App Connector Status. Client Type Web Browser → Browser Access, not posture. Allowed and slow → ZDX hop.”
2. Mental model — five rungs
Memorise five named objects before you click. Each rung is allowed to prove one thing. Over-claiming a green tile is how you restart a healthy pair at 02:00 and miss the deny.
1 · User Activity
ZPA Logs → Insights → Diagnostics, Log Type = User Activity. Proves the private-app session: Connection Status + Policy + Connector. Empty row is data — switch to User Status.
2 · App Connector health
Infrastructure → Private Access → Component → App Connectors, then Diagnostics Log Type App Connector Status. Proves Enabled, group membership, Connected / Disconnected. Application health is a separate Up / Down.
3 · Access Policy
Policies → Access Control → Private Applications → Access Policy. Default-deny. Most-specific Application Segment, then top-down first-match. Enabled on the segment is not an Allow.
4 · Browser Access
Clientless path. Client Type = Web Browser (or Web Browser Unauthenticated). No Client Connector, so posture and Trusted Network criteria cannot match. The EUN carries the error code.
5 · ZDX hop
ZDX Users / Applications → Cloud Path → Hop View. Proves where latency or packet loss jumped after the session already succeeded. Score 0–100 is the pointer. The hop is the proof.
Hard words, once
Service Edge = the ZPA node the client attached to. LSS = ZPA’s streamer (not NSS). Health Reporting = Continuous / On Access / None; the connector then paints the app Up or Down. Connector ID 0 = Central Authority could not pick a member.
Read left → right. Each box is allowed one claim. If you cannot name the field, you are not proving — you are guessing.
I prove the session, then the connector, then the policy, then the client type, then the hop. I do not restart a healthy App Connector pair, reorder Access Policy, or declare a tenant Sev-1 until I can quote the field that made me do it.
3. Decision flow — symptom → first rung
Flowchart first. Do not open the policy editor, and do not systemctl restart zpa-connector, until a diamond says so.
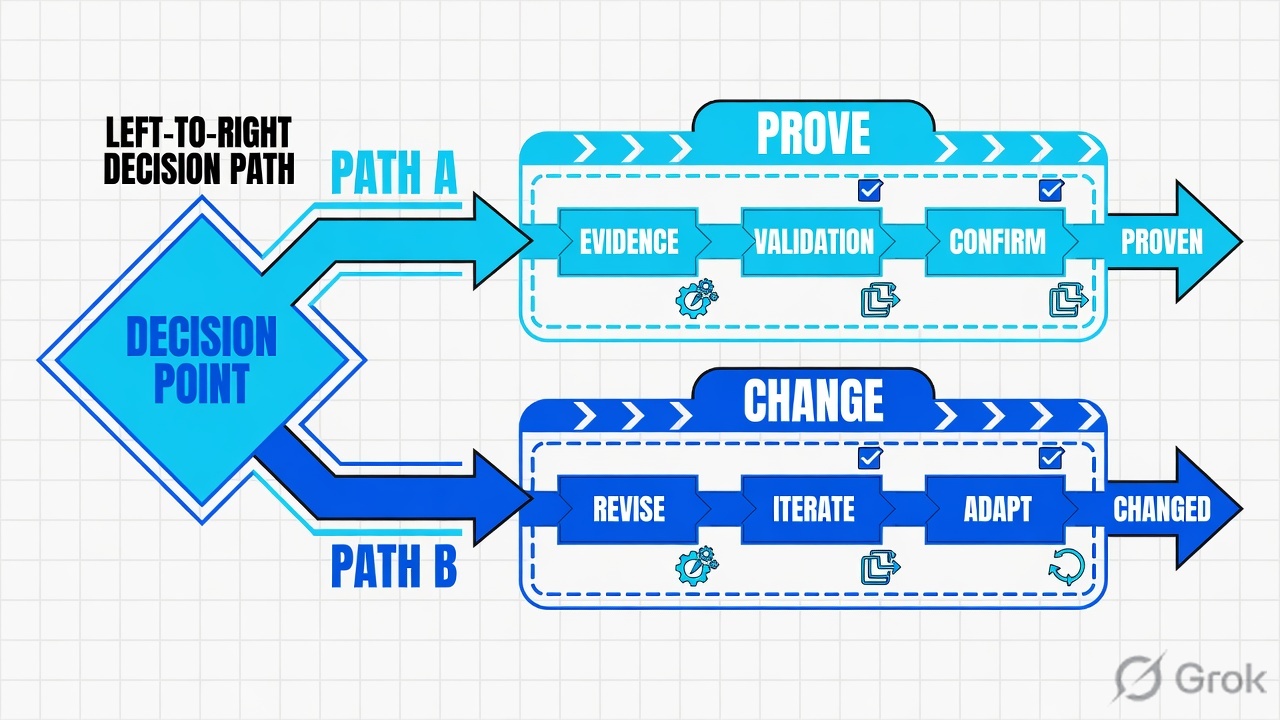
Read the diamond first. A private FQDN never starts in Web Insights. Allowed + slow never starts in Access Policy. Authentication Failed never starts in NO_CONNECTOR_AVAILABLE.
4. How to choose — first tool + proof field
Print this next to the ZPA Admin Portal. If you cannot recite the proof field, you are not ready to change a rule or a VM.
| If the ticket says… | First tool (official path) | Proof field | Do not open first |
|---|---|---|---|
| Private FQDN “no connection”; Client Connector icon looks green | ZPA Logs → Insights → Diagnostics · Log Type User Activity | Connection Status + Policy + Connector (session status codes live on this page) |
Restart both App Connectors |
| User Activity is empty for that user + FQDN + window | Same Diagnostics page · Log Type User Status | Authenticated / Authentication Failed / Disconnected + Client Type |
A new Access Policy Allow |
| User Activity shows a policy block / “user isn’t allowed” | Policies → Access Control → Private Applications → Access Policy | The Policy field on the User Activity row = the rule that actually matched |
App Connector reboot |
NO_CONNECTOR_AVAILABLE or Connector ID is 0 |
Diagnostics · Log Type App Connector Status + App Connectors page | Connection: Status Code (Disconnected) + App Connector Group vs Server Group binding |
A Cloud App / URL rule in ZIA |
| Connector is Connected; app still fails; health Down | Application Segment Health Reporting + User Activity APP_NOT_REACHABLE |
Health Up / Down from the connector’s view of the server — not the cloud tile | Force re-auth the org |
| No Client Connector; browser EUN on a Browser Access FQDN | User Activity Client Type + Locating Browser Access Error Codes |
EUN error code + Client Type = Web Browser. Posture cannot match. |
A ZCC posture profile edit as the first fix |
| Session succeeded; user still says “HR is slow” | ZDX Users / Applications → Cloud Path → Hop View | Per-hop latency and packet loss (Score 0–100 is the pointer) |
A second Access Policy Allow |
Zscaler Help — Troubleshooting App Connectors: if the Central Authority cannot determine an application or resolve the connection to an App Connector, the App Connector ID displays as zero. That happens for APP_NOT_REACHABLE, INVALID_DOMAIN, and NO_CONNECTOR_AVAILABLE. Zero is the proof. It is not “logs are delayed.”
5. Runbook Side A → B → C
Side A proves the session. Side B proves the member and the rule. Side C proves the clientless path and the hop the user felt. On a messy Sev-2, do them in this order until a field lights up.
Side A — User Activity, then User Status
-
Write the control sample before you open Admin
User, destination FQDN, TCP/UDP port, UTC window, Client Connector vs browser. A screenshot of a green icon is not a sample. Official: Accessing User Activity Diagnostics.
-
Open User Activity, not the App Connectors page
Path: Logs → Insights → Diagnostics. From Log Type, select User Activity. Filter Username + Application Segment + time. A private FQDN will not appear as a ZIA URL Category hit. Live events, if you need them in the same minute: Logs → Insights → Live Logs.
-
Read Connection Status, then Policy, then Connector
Session status codes appear on the User Activity Diagnostics page (Understanding Private Access Session Status Codes). LSS User Activity fields for the same session include
ConnectionStatus,Policy,Connector,Application,Server,InternalReason,Host,ServicePort. -
If there is no User Activity row, switch to User Status
Same Diagnostics page, Log Type = User Status. Official Connection: Status Code values include Authenticated (including re-auth), Authentication Failed, and Disconnected. That answers “did Client Connector attach to a ZPA Service Edge?” It does not answer “did HR load.” Also read
Client Type— Branch Connector, Zscaler Client Connector, Client Connector Partner, Web Browser, Web Browser Unauthenticated, ZIA Inspection, or ZIA Public Service Edge.
Path:            Logs → Insights → Diagnostics
Log Type:        User Activity
Username:        contractor@lab.example
Application:     HR-Prod
Quote:           Connection Status + Policy + Connector + Server
If empty row:    Log Type = User Status
                 Authenticated / Authentication Failed / Disconnected
If ID = 0: NO_CONNECTOR_AVAILABLE | APP_NOT_REACHABLE | INVALID_DOMAINLogs / Insights / Diagnostics / User Activity
User Activity Diagnostics
| User | Host | Connection Status | Policy | Connector |
|---|---|---|---|---|
| finance@lab.example | hr.internal.example | OK | Allow-Finance-HR | mum-ac-01 |
| contractor@lab.example | hr.internal.example | Blocked | Block-Contractors-HR | — |
Source: Zscaler Help — Accessing User Activity Diagnostics; Understanding Private Access Session Status Codes; Understanding User Activity Log Fields (ConnectionStatus, Policy, Connector). Lab identities only. Training mock · not live.
Side B — App Connector health, then Access Policy
-
Prove the member exists in the bound group
Path: Infrastructure → Private Access → Component → App Connectors. Confirm Status is Enabled, the row sits in the intended App Connector Group, and connections are up. Optional dashboard: Analytics → Switch to Existing Reports → Private Applications → App Connectors (and Health). A healthy VM in a different group does not serve HR.
-
Open App Connector Status, filter Disconnected
Official Troubleshooting App Connectors: Logs → Insights → Diagnostics → Log Type App Connector Status → Add Filters → Connection: Status Code Equals Disconnected → Apply. Read Disconnect Time. Do not restart the pair that stayed Connected through the window.
-
Split NO_CONNECTOR_AVAILABLE from APP_NOT_REACHABLE
NO_CONNECTOR_AVAILABLE+ Connector ID 0 = Central Authority could not pick an eligible member (wrong group, all members Disconnected, group disabled, or members paused for upgrade).APP_NOT_REACHABLE= a connector was selected and still could not open the application. Health Reporting on the Application Segment is Continuous, On Access, or None; the connector then paints the app Up or Down. Source: Understanding Health Reporting; Viewing the Health Dashboard. -
Only then open Access Policy
If User Activity already named a
Policy, that is the rule you edit — not a new Allow at the bottom. Official current path: Policies → Access Control → Private Applications → Access Policy. Classic ZPA Admin still says Policy → Access Policy. ZPA is default-deny until a rule explicitly allows. Evaluation is most-specific Application Segment, then top-down first-match. List a Block above a broader Allow. Criteria (SAML, SCIM, posture, Client Type, Trusted Network) are AND across types and OR inside one type.
Logs / Insights / Diagnostics / App Connector Status
App Connector Status
| Name | Group | Status | Connection | Disconnect Time |
|---|---|---|---|---|
| mum-ac-01 | DC1-MUM-AppConnectors | Enabled | Connected | — |
| mum-ac-02 | DC1-MUM-AppConnectors | Enabled | Connected | — |
| mum-ac-03 | DC2-BLR-AppConnectors | Enabled | Disconnected | 01:48 UTC |
Connection Status = NO_CONNECTOR_AVAILABLE · Connector ID = 0
Server Group still bound to DC2-BLR-AppConnectors — not the green Mumbai pair.
Source: Zscaler Help — Accessing App Connector Status Diagnostics; Troubleshooting App Connectors (filter Connection: Status Code Equals Disconnected; Connector ID 0 for NO_CONNECTOR_AVAILABLE / APP_NOT_REACHABLE / INVALID_DOMAIN). Training mock · not live.
Policies / Access Control / Private Applications / Access Policy
Access Policy
First-match, top-down. Implicit deny handles everyone these rules do not match. No bottom Block-All.
Source: Zscaler Help — About Access Policy; Configuring Access Policies (Policies → Access Control → Private Applications → Access Policy). Official Help: list the block rule before the allow. Training mock · not live.
Official Troubleshooting App Connectors (Linux systemd image): sudo systemctl status zpa-connector should be active. A healthy App Connector typically has two processes; parent-only often means the child is not healthy. Re-enroll is wipe + new key — not a hopeful restart of a Connected member. Do not paste a live provisioning key into the ticket.
Side C — Browser Access, then the ZDX hop
-
Confirm Client Type before you blame posture
Browser Access lets a user authenticate and reach an application over ZPA from a web browser without installing Client Connector (About Browser Access). On User Activity / User Status,
Client Typeis Web Browser or Web Browser Unauthenticated. Posture Profile and Trusted Network are ZCC-only. A rule that ANDs posture will never match a browser session — it is skipped, then default-deny. -
Read the EUN code, not the Slack paraphrase
Official: Locating Browser Access Error Codes. If the user hits a Browser Access-enabled application and fails, the end user notification includes the error code. Quote that code. Also confirm the Application Segment actually has Browser Access defined (Help also documents Policies → Access Control → Clientless → Browser Access for the clientless object). Browser Access LSS fields include
ConnectionStatus— same discipline as User Activity. -
Only if the session already succeeded, open Hop View
ZDX does not invent Cloud Path for every private FQDN. If HR has no probe, Hop View is empty and you cannot prove a hop. Official: Evaluating the Cloud Path. ZDX traces the path and measures latency, packet loss, and jitter. Hop View and Command Line View both exist; errors show as icons (Cloud Path Errors). Quote the hop, not the headline score.
-
Treat Score as a pointer
Understanding the ZDX Score: 0 (lowest) to 100 (highest). Score uses Cloud Path probe metrics — end-to-end latency, packet loss, hops. A 42 versus peers at 81 is a gap. It is not an Access Policy change and it is not a tenant Sev-1 by itself.
- Side A: User Activity names
Connection Status+Policy+Connectorfor that user, FQDN, and UTC minute. Empty → User Status quoted first. - Side B: App Connectors page shows N+1 Enabled members in the bound group; Diagnostics is not Disconnected in the window; application health is Up. Policy field is the intended rule — Block above Allow if you needed a deny.
- Side C: Browser Access tickets quote EUN code + Client Type. Slow tickets quote a hop’s latency / loss; Score recovers after the path change, without a new Allow.
6. Five tickets as full stories
These five land every quarter. Memorise first tool + proof field. Times and identities below are lab-only.
| Ticket | Symptom | First tool | Proof field |
|---|---|---|---|
| ZPA-CC-01 | Contractor: “HR is down”; User Activity empty | User Status | Authentication Failed / not Authenticated |
| ZPA-CC-02 | Segment Enabled; finance works; contractor blocked | User Activity | Connection Status deny + Policy = Block-Contractors-HR |
| ZPA-CC-03 | Mumbai pair green; Connector ID 0 | App Connector Status | NO_CONNECTOR_AVAILABLE + wrong group / Disconnected member |
| ZPA-CC-04 | Browser EUN; posture rule on the Allow | Client Type + EUN code | Client Type = Web Browser; posture never matched |
| ZPA-CC-05 | Session OK; “HR is slow” | ZDX Cloud Path → Hop View | Hop with jump in latency / packet loss |
ZPA-CC-01 — Empty User Activity (User Status first)
01:52 · P2. Contractor on a hotel network. Phone photo of a green-ish Client Connector icon. L1 drafted a new Access Policy Allow and a connector restart.
First tool: Logs → Insights → Diagnostics · Log Type User Activity, user + HR-Prod + last 30 minutes. The grid is empty.
Next tool: same page, Log Type User Status. Proof field: Authentication Failed (or no Authenticated event in the window). The device never built a ZPA session — token, enrollment, or Client Connector attach. There is no Policy to chase and no Connector to restart.
Bypass Type = Always (or On Net while the device is on a trusted network) also yields an empty User Activity row because Client Connector sent the packet direct. Set Bypass = Never on the lab segment if you need a row at all. Empty is not “logs are delayed.”
ZPA-CC-02 — Policy deny (Enabled is not an Allow)
02:08 · P2. Application Segment HR-Prod is Enabled. Finance opens hr.internal.example. The contractor cannot. Someone wants the Deny moved to the bottom “like a firewall.”
First tool: User Activity. Filter contractor + HR-Prod.
Proof field: Connection Status is the official block wording — the Private Access service blocked the request because the user isn’t allowed to access the requested application — and Policy = Block-Contractors-HR. That name is the ticket. If Policy is instead Allow-Finance-HR, first-match already fired the Allow above the Block — drag the Block above the Allow. Official Help: list the block rule before the allow. If Policy is empty and there is still a deny, you are on implicit default-deny: no Allow matched that most-specific segment.
I would not add a second Allow at the bottom. I would quote Policy on the contractor row. Save is not proof until the same filter returns the intended rule name — or, for an intern in neither group, no Allow match.
ZPA-CC-03 — Connector ID 0 (the green pair is the wrong group)
02:24 · P1. Whole HR cohort failing after a Server Group edit. Mumbai App Connectors page is a wall of green. L1 wants both VMs rebooted.
First tool: User Activity. Proof: Connection Status = NO_CONNECTOR_AVAILABLE, Connector ID = 0. Official Troubleshooting App Connectors: ID 0 means the Central Authority could not resolve a connector — also seen with APP_NOT_REACHABLE and INVALID_DOMAIN.
Next tool: App Connector Status, filter Disconnected, plus the Server Group → App Connector Group binding. In the lab, HR’s Server Group still points at DC2-BLR-AppConnectors. Mumbai being green is a different object. If instead the bound members are Connected and health is Down, you are on APP_NOT_REACHABLE — the connector exists and the server is dark. That is a server / DNS / port problem, not a reboot of a Connected member.
Quote ID 0 + the group mismatch (or health Down). Re-bind the Server Group, or restore the Disconnected member, then wait for a User Activity row that names a real Connector — not zero. Restarting the green Mumbai pair is change-control, not isolate.
ZPA-CC-04 — Browser Access (posture cannot match)
02:40 · P2. A contractor on a kiosk browser hits the Browser Access FQDN and gets an EUN. The Allow rule ANDs Posture Profile = Compliant-Win. Someone wants Client Connector pushed to the kiosk at 02:00.
First tool: User Activity / User Status Client Type = Web Browser. Official About Browser Access: no Client Connector install. Posture and Trusted Network have nothing to report, so the criterion is skipped and the rule never matches — then default-deny.
Proof field: the EUN error code (Locating Browser Access Error Codes) plus Client Type. Write a separate clientless Allow without posture, or send the user through ZCC. Do not “fix posture” on a browser that cannot run it.
Web Insights will not show hr.internal.example as a URL Category hit. Restarting a healthy Connector pair does not make a posture rule match a Web Browser client.
ZPA-CC-05 — Session succeeded; the hop is the ticket
03:02 · P3. HR “the private app is slow” for one laptop. User Activity Connection Status succeeds; Policy = Allow-Finance-HR; Connector = mum-ac-01. Someone typed Sev-1 in the channel.
First tool: ZDX → that user → HR → Cloud Path → Hop View — only if a probe exists.
Proof field: the hop whose latency / packet loss jumped — often device → ISP, or Service Edge → app — plus the path-change time. Score 42 versus peers 81 is the pointer. It is not a new Allow and it is not a tenant outage by itself.
I would leave Access Policy alone. I would paste the hop row and the peer gap. If hops 1–2 are clean and the edge → app hop is not, that is the path or the application — not a ZPA rule.
7. Traps + close-the-ticket proof
| You see | Weak close | Strong close |
|---|---|---|
| Green Client Connector icon | “ZPA is working” | User Activity Connection Status + Policy + Connector for that FQDN |
| Empty User Activity | A new Access Policy Allow | User Status first; or Bypass Always / On Net (no row by design) |
| Segment Enabled, user blocked | Re-enable the segment / restart connectors | Enabled is the object. Default-deny until an Allow matches. Quote Policy |
| Broad Allow above a contractor Block | “Block rules are broken” | First-match: Policy = the Allow. Drag Block above Allow |
| Green Mumbai connectors | Reboot both VMs | Server Group must bind the group that actually serves HR. ID 0 is official |
NO_CONNECTOR_AVAILABLE | “ZPA cloud is down” | No eligible member in the bound group. App Connector Status + group membership |
APP_NOT_REACHABLE + health Down | Reboot a Connected connector | Connector can reach the cloud and cannot open the server. Fix DNS / port / host |
| Browser Access EUN | Attach a posture profile | Client Type = Web Browser. Write a clientless rule without posture. Quote the EUN code |
| Session OK + slow | Tenant Sev-1 / second Allow | ZDX hop latency / loss + path-change + peer compare |
| SCIM group rule never matches; SSO works | Rewrite the Application Segment | IdP toggle “SCIM Attributes and Groups for Policy” (and SAML’s twin) must be On — Off skips the criterion |
| 443 works, 8443 fails | “ZPA is flaky” | Ports are part of the segment definition. No Application match for that port |
Read left → right, then down. “No healthy connector” is the left box. A green connector that cannot open HR is the amber box. Both can show Connector ID 0 on User Activity.
- UTC window written next to the tool you opened. User + FQDN + port on the ticket.
- User Activity quoted:
Connection Status+Policy+Connector— or User Status quoted if the grid was empty. - If ID = 0, the official code is named (
NO_CONNECTOR_AVAILABLE/APP_NOT_REACHABLE/INVALID_DOMAIN) and the bound App Connector Group is named. - If Browser Access,
Client Typeand the EUN code are on the ticket. Posture is not the first edit. - If slow, a hop’s latency / loss is quoted — not a ZDX Score alone, not a new Allow.
- Next tool named — or change-control owner named. No Save without residual control. Retest the same user and FQDN.
I name the question, then the first rung, then one official field. User Activity proves the private session. User Status proves attach. App Connector Status proves the member. Access Policy proves who was allowed. Browser Access proves clientless. ZDX hop proves the feel. I do not restart a healthy pair or reorder policy until that field is on the ticket. Deeper log-store map: Lesson 13 · which log answers which ticket.
Knowledge check
Six night-shift judgments. Each maps to a first rung or a proof field. Check answers, then Reset if you picked the wrong surface.
Sources
- Zscaler Help — Accessing User Activity Diagnostics (Logs → Insights → Diagnostics · Log Type: User Activity)
- Zscaler Help — Accessing User Status Diagnostics (Authenticated / Authentication Failed / Disconnected; Client Type)
- Zscaler Help — Understanding Private Access Session Status Codes (codes on the User Activity Diagnostics page)
- Zscaler Help — Understanding User Activity Log Fields (LSS:
ConnectionStatus,Policy,Connector,InternalReason) - Zscaler Help — Accessing Live Logs (Logs → Insights → Live Logs)
- Zscaler Help — Accessing App Connector Status Diagnostics (Log Type: App Connector Status)
- Zscaler Help — Troubleshooting App Connectors (Disconnected filter; Connector ID 0;
NO_CONNECTOR_AVAILABLE/APP_NOT_REACHABLE/INVALID_DOMAIN) - Zscaler Help — Understanding Health Reporting (application health Up / Down)
- Zscaler Help — Viewing the Health Dashboard
- Zscaler Help — About App Connectors (Status enabled/disabled; connection / health)
- Zscaler Help — About Access Policy
- Zscaler Help — Configuring Access Policies (Policies → Access Control → Private Applications → Access Policy; default block)
- Zscaler Help — Access Policy Deployment and Operations Guide (application not accessible → Access Policy / implicit block)
- Zscaler Help — About Browser Access (browser auth and access without Client Connector)
- Zscaler Help — Locating Browser Access Error Codes (EUN includes the error code)
- Zscaler Help — Understanding Browser Access Log Fields (
ConnectionStatus) - Zscaler Help — Evaluating the Cloud Path (Hop View; latency, packet loss, jitter)
- Zscaler Help — Cloud Path Errors
- Zscaler Help — Understanding the ZDX Score (0–100; latency, packet loss, hops)
Related: Lesson 13 · which log answers which ticket · Evidence desk · first tool + proof field · Lesson 10 · App Connectors · Lesson 11 · Access Policy · Lesson 9 · ZPA architecture · Zscaler practice dashboard