Lessons · Zscaler series · Risk360 exposure scoring
This lesson is Risk360 organisation exposure scoring: four attack-stage categories, weighted factors, recommended actions. ZIA User Risk Score is a different object (pre-/post-infection behaviour on a user, can feed Risk360). Internet-facing inventory without a Risk360 factor is a different product class — see Xpanse if that is the ticket.
Zero Trust Exchange factory · ZIA DLP · Cortex Xpanse attack surface
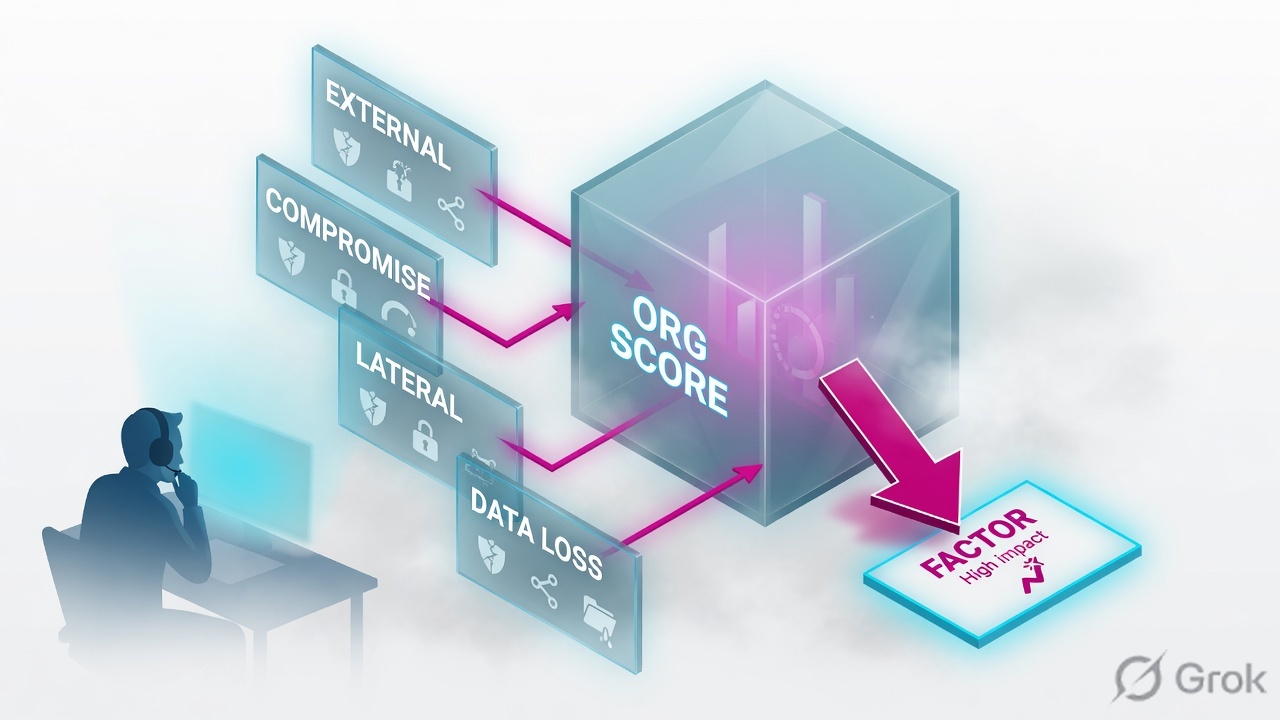
Risk360 scores cyber risk at organisation level as the average of External Attack Surface, Compromise, Lateral Propagation and Data Loss. Documented org bands: Low 0–25, Medium 26–50, High 51–75, Critical 76–100. Each contributing factor has a risk weight, a Your Score (0 = healthy), severity (critical / high / medium), entities (workforce, 3rd parties, applications, assets), a Licensed? flag and a recommended action. Fix the owning control (ZIA, ZPA, seed domain, or a Data Fabric connector). Proof is the factor’s Last 30 Days trend and Your Score moving toward 0 — not peer rank and not a closed ticket.
Why the org number is not a ticket
The day-one ticket is always the same: “Risk360 is High, make it green.” Wrong object. The dashboard number is an average across four attack stages. Owners cannot patch an average. They can patch an exposed server, a malware outbreak, a segmentation gap, or uploads to a risky app — the examples Zscaler itself uses as score inputs.
Three silent-stuck states look identical from the board pack (a High tile):
- External Attack Surface moved because Seeds Management has no domain (or the 24–48 h first scan has not finished). Compromise is quiet. The average still looks “the org.”
- A factor’s Recommended Action needs a Zscaler feature you are not subscribed to — Licensed? = N. The factor is real; the click-path in this tenant is not.
- Someone excluded an entity from score computation (Include toggle) so the board number dropped. The server is still on the internet. Exclusion is an override, not a fix.
This page never assigns a fake integer to lab.example. Use the documented band (High = 51–75) and the factor fields. Peer score is a comparison strategy (default Zscaler-defined, or custom industry / region / revenue). Beating peers is not remediation. Monte Carlo dollars on Financial Risk are a loss estimate, not the org score.
Score, category, factor, entity
An organisation risk score is the average of the four category scores. Hover the dollar symbol for financial estimates; View Details opens Financial Risk. That is a different page. Category scores still have to be explained by factors.
A factor is the quantified condition. Risk360 weights it, adds it to the org score, and maps it to frameworks such as MITRE and NIST. Your Score on the factor depends on severity; 0 is a healthy score. Last 30 Days is the trend graph. Entities name who or what is affected. Recommended Actions are how you drive the factor toward healthy — if Licensed? is Y.
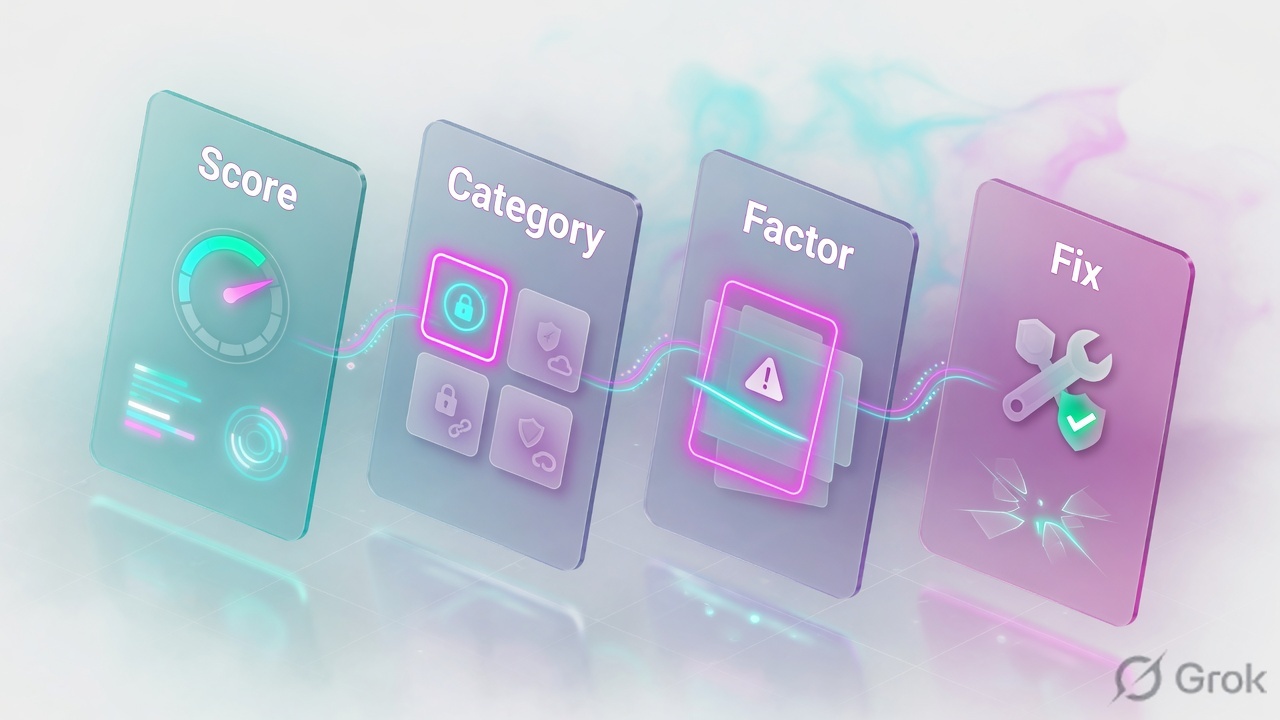
Org score
Average of four categories. Bands: Low 0–25, Medium 26–50, High 51–75, Critical 76–100. GUI: Dashboard (Experience Center: Analytics › Risk360).
Category
External Attack Surface (exposed servers, ASNs). Compromise (events, configs, traffic). Lateral Propagation (private access / segmentation). Data Loss (sensitive-data attributes).
Factor
Weighted input. Fields: Factor Name, Category, Your Score, Last 30 Days, Entities, Licensed?, Recommended Actions. List View = attack-based; Tree View = entity-based.
Entity
Workforce (risky user activity), 3rd Parties (contractors), Applications (unsanctioned / weaker SaaS), Assets (exposed organisational assets). Filter tiles on Tree View.
The org score is an average of four stages. I do not fix the average. I open the factor, read the entity and the recommended action, change the owning control, then watch Your Score toward 0.
Dashboard → factor → recommended action
Read the dashboard first, but do not stop there. Identify which of the four categories moved. Open Top 10 Factors (View All → Factors) or High Impact Recommendations (Explore / View All → Insights). On the factor, the drawer has Details (severity, recommended actions, description, help link, jump to the responsible Zscaler service), Notes, and related problems. Insights lists the problem statement plus the recommendation. Investigate is where you can include or exclude an entity — with an Entity Override Note, which lands in audit logs.
Read left → right, then the gold bar. Route the human to the factor before anyone debates the average.
| Object | Lab / documented value | If missing |
|---|---|---|
| Org score band | High (51–75) — documented range, not an invented tenant integer | You are arguing a colour. Open the four category scores. |
| Category | External Attack Surface (lab) — exposed servers / ASNs | Average hides a quiet Compromise next to a loud External. |
| Seed domain | lab.example · max 10 domains · first scan 24–48 h · weekly after | EAS factors stay empty or stale. Score is not “safe”; it is under-fed. |
| Factor | Dashboard example: exposed servers · Your Score not 0 · Severity High | No work item. Owners are correct that the org tile is not actionable. |
| Entities | Assets (lab). Also Workforce, 3rd Parties, Applications | Cannot assign an owner. Tree View filter tiles are empty of meaning. |
| Licensed? | Y or N for the feature the recommended action needs | N: do not call the factor a false positive. Escalate licence or pick another action. |
| Recommended action | Drawer + Insights problem/recommendation · Explore | You will change the wrong ZIA rule. Follow the jump link to the responsible service. |
| Closure proof | Last 30 Days down · Your Score toward 0 | Jira Resolved while the factor graph is flat. Board pack still High. |
Factor vs peer vs dollars vs asset score
Pick the pane for the question you are actually answering. Mixing them is the usual “we beat peers so the exposed server is fine” ticket.
Four columns, four tickets. The gold panel is the only one that names a recommended action.
| Need | Use | Skip |
|---|---|---|
| What should ops do this week? | Factors List View + High Impact Recommendations / Insights | Org tile alone, or peer rank. |
| Who is affected? | Tree View entity tiles: Workforce, 3rd Parties, Applications, Assets | Mailing security@ with the average. |
| Board $ exposure | Financial Risk · Monte Carlo (optionally Simulate breach probability) | Treating the dollar hover as a factor score. |
| Are we worse than industry? | Peer Score Settings (default Zscaler-defined, or custom vertical / region / revenue) | Using “better than peer” as closure of an exposed-server factor. |
| EDR / vuln scanner input | Data Fabric connector, then the named Risk360 factor (e.g. CrowdStrike - Zero Trust Score) | Assuming ZTE telemetry already covers CrowdStrike unmanaged devices. |
Runbook Side A / B / C
Side A is feed and dashboard read. Side B is the factor and the recommended action. Side C is the owning control and the re-score. Do not start at C, and do not start in Jira.
Side A — seed the surface, read the average
-
Admin role, then Seeds Management
Experience Center: add a Risk360 admin role and assign it via ZIdentity / Authentication Service entitlements. Then Administration › Admin Management › Administrator Management › Seeds Management. Add
lab.example(max 10 domains, or CSV). First scan 24–48 h; then weekly. Source: Step-by-Step Configuration Guide for Risk360; Adding a Domain for External Attack Surface Analysis. -
Open Dashboard — name the band and the category
Analytics › Risk360 › Dashboard (or Risk360 Admin Portal › Dashboard). Read the org band (Low / Medium / High / Critical). Identify which of the four categories is driving it. Do not quote a made-up integer in the ticket. Source: About the Dashboard in Risk360.
Analytics / Risk360 / Dashboard
Organisation risk score
Training mock. Band is documented; no tenant integer is invented. Next click: View All → Factors, or Explore on a High Impact Recommendation. Source: About the Dashboard in Risk360.
Side B — factor drawer, then Insights
-
Open the factor — List View first
Factors. Attack-based List View is one list you can CSV-export (export ignores UI filters). Tree View is entity-based. Columns: Factor Name, Category, Your Score, Last 30 Days, Entities, Licensed?, Recommended Actions. Click a column (not Licensed?, Include, or Entities) for the drawer. Source: About Factors.
-
Read Details before changing policy
Drawer: severity (critical / high / medium), recommended actions, description, help article, link to the Zscaler service responsible for the factor. Notes are yours. Related problems jump to Insights. If Licensed? is N, stop and name the missing feature — do not “tune” an unrelated ZIA rule.
-
Insights = the remediation queue
Insights: problem title, category, generated day, problem statement, recommendation, trend, Explore. High Impact Recommendations on the dashboard View All lands here. Source: About Insights in Risk360.
Factors / List View / exposed servers
Factor drawer · Details
Training mock. “exposed servers” is a dashboard example of an underlying factor, not a made-up product SKU. Your Score is shown as not-0 on purpose — this page does not invent a tenant integer. Source: About Factors; About the Dashboard.
Tenant: lab.example (seed)
Org band: High (51-75)     # documented range, not a made-up integer
Category moved: External Attack Surface
Factor: exposed servers
Your Score: not 0 (0 = healthy)
Severity: High
Entities: Assets
Licensed?: Y
Last 30 Days: rising
Recommended action: (paste from drawer / Insights)
Owning control: (ZIA / ZPA / seed / Data Fabric connector)
Proof after change: Last 30 Days + Your Score toward 0
Do not: exclude entity without Entity Override Note; do not quote peer as closure
Side C — change the owning control, then re-score
-
Fix where the factor is generated
Use the drawer’s jump to the responsible Zscaler service. External Attack Surface often means take the host off the internet (or correct the seed). Compromise / Data Loss often means ZIA threat or DLP policy. Lateral Propagation often means ZPA / segmentation. Third-party named factors need the Data Fabric connector actually ingesting (CrowdStrike CrowdScore, Qualys, Tenable, Rapid7 InsightVM, Wiz, Microsoft Defender for Endpoint — as documented). Source: Integrating 3rd-Party Connectors for Risk Factors; What is Risk360.
-
Include / exclude is an override, not a patch
On Investigate, Include toggle + Entity Override Note (reason required). Multi-entity edits share one note. Username and reason go to audit logs. Use this for false attribution, not to paint the board pack green. Source: Investigating Sections of a Problem.
-
Prove on the factor, not on Jira
Re-open the same factor. Last 30 Days should bend. Your Score should move toward 0. Org band may lag because it is an average of four categories. Optional: alert rule on org / factor-group / factor score change, or on potential financial loss — email or webhook (Analytics › Risk360 › Alerts › Webhooks). Source: About Alerts; About Factors.
Same factor row: Last 30 Days no longer rising, Your Score toward 0, Licensed? still Y, entity still included. Org band may still be High if another category did not move — that is the average working as designed, not a failed fix.
One investigation after go-live
Monday: Dashboard High (51–75). External Attack Surface is the category that moved. Top 10 shows exposed servers, entity Assets, Licensed? Y, Your Score not 0. Drawer recommended action plus Insights Explore name the internet-facing asset on seed lab.example. Owner takes the host off the public edge (or you wait out the 24–48 h if the seed was only just added). You do not exclude the entity. You do not reset a ZIA User Risk Score to Low.
Wednesday: same factor, Last 30 Days bending down, Your Score nearer 0. Compromise and Data Loss unchanged, so the org average may still sit in High. That is expected. File residual risk against the other two categories, not against this factor.

Alert rules can fire on change in risk score at organisation, factor-group, and factor levels, and on change in potential financial loss. If you only alert on the org tile, a loud External factor can be cancelled in the average by a quiet Data Loss category until it is too late for the owner.
Traps + proof
| Symptom | Likely cause | Proof |
|---|---|---|
| High org tile, owners refuse the ticket | Nobody opened the factor / entity / recommended action | Dashboard Top 10 + Factors drawer fields in the ticket body |
| EAS category empty or stale | No seed domain, or still inside 24–48 h first scan | Seeds Management list; scan frequency weekly after add |
| Recommended action does nothing | Licensed? = N, or jump link ignored and a random ZIA rule was edited | Licensed? column; drawer link to the responsible service |
| Org number dropped overnight, server still public | Include toggle excluded the entity | Audit log: username + Entity Override Note |
| “We beat industry” | Peer strategy used as closure | Peer Score Settings (default vs custom). Factor Last 30 Days unchanged |
| CrowdStrike / Qualys factor silent | Data Fabric connector not ingesting | Connector config; named factors in the 3rd-party table |
| Jira Resolved, board still High | Average of four categories; other category still loud — or factor never moved | Same factor Your Score still not 0; check the other three categories |
| User Risk Score reset to Low | Wrong object. That is ZIA user behaviour, not the org factor | Factors page still lists the org factor |
The recommended action is scoped to the factor and the responsible service. A tenant-wide ZIA block to paint the org tile is how you create the next outage ticket. Follow Insights, then prove on that factor’s Last 30 Days.
- Risk360 admin role assigned. Seeds Management has
lab.example(≤ 10). Wait 24–48 h before calling EAS “empty.” - Dashboard: org band named (not an invented integer). Category that moved named.
- Factor row captured: name, category, Your Score (0 = healthy), Last 30 Days, entities, Licensed?, recommended action.
- Insights Explore opened. If Include/exclude used: Entity Override Note in audit.
- Owning control changed. Re-read the same factor. Your Score toward 0. Org band allowed to lag.
Knowledge check
Six judgment items. Submit once. Reasons point back at the section to re-read.
Sources
- Zscaler Help — What is Risk360 (four attack stages: External Attack Surface, Compromise, Lateral Propagation, Data Loss)
- Zscaler Help — About the Dashboard in Risk360 (org score is the average of four categories; bands Low 0–25, Medium 26–50, High 51–75, Critical 76–100; Top 10 Factors; High Impact Recommendations; entities Workforce / 3rd Parties / Applications / Assets; Your Score 0 = healthy)
- Zscaler Help — Viewing the Risk360 Dashboard (Experience Center: Analytics › Risk360)
- Zscaler Help — About Factors (risk weight; List View / Tree View; drawer Details; Licensed?; MITRE / NIST mapping)
- Zscaler Help — About Insights in Risk360 (problem + recommendation + Explore)
- Zscaler Help — Investigating Sections of a Problem (Include toggle, Entity Override Note, audit)
- Zscaler Help — Adding a Domain for External Attack Surface Analysis and About Seeds Management (≤ 10 domains, 24–48 h, weekly scans)
- Zscaler Help — Step-by-Step Configuration Guide for Risk360
- Zscaler Help — Accessing and Navigating the Risk360 Admin Portal (Dashboard, Factors, Assets, Insights, Financial Risk, Frameworks, Reports)
- Zscaler Help — Integrating 3rd-Party Connectors for Risk Factors (Data Fabric; CrowdStrike, Qualys, Tenable, Rapid7, Wiz, MDE)
- Zscaler Help — About Alerts and Configuring Alert Webhooks
- Zscaler Help — Viewing Asset-Level Risk (asset-level model is separate from the org average)
- Zscaler Help — Managing Peer Score Settings
- Zscaler — Risk360 product and Risk360 solution brief (100+ factors; 0–100 with 100 critical — marketing scale; this lesson uses Help bands for operations)
Related: Zero Trust Exchange factory · ZIA authentication (SAML + SCIM) · ZIA DLP · ZPA access policy · Cortex Xpanse — internet-facing asset