Endpoint Inventory answers “is this host talking to Vision One?” Workbench answers “did a detection model correlate an alert — and which one?” XDR Data Explorer answers “what telemetry or detection events exist for this host / Event UUID?” Observed Attack Techniques answers “did a filter fire even though Workbench stayed empty?” Policy (Detection Model Management + Endpoint Security Policies) answers “was the model or XDR for Endpoints (EDR) even on?” A green last-seen is not a Workbench case. An OAT row is not a Workbench ID. A High CREM tile is the factory queue, not this desk.
1. Why “is it seeing this?” is five questions
Operators collapse five failures into one sentence. The sensor never checked in. The host is unmanaged. A filter fired and never became a Workbench alert. The detection model is off. XDR for Endpoints (EDR) is disabled on the assigned policy. Those are five first clicks.
Concept: Vision One can only correlate what a connected product actually sent. Path: prove the sensor, then the alert, then the event, then the filter, then the policy. Do: quote one official field before you isolate or add an exception.
The factory taught Workbench versus CREM. This page is the night-shift desk for proof. When someone asks whether Vision One is seeing the endpoint — or why Workbench is empty — you open one of five official apps, in order, and you paste a named field.
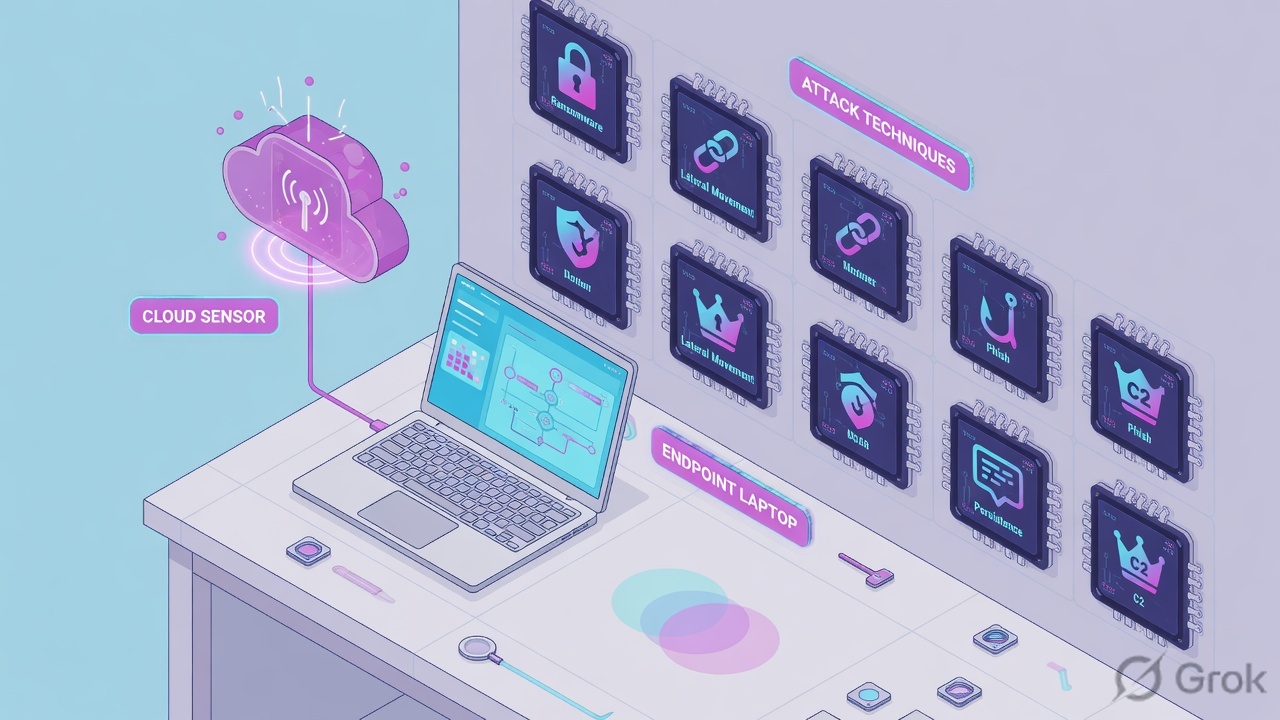
If they say “prove Vision One is seeing this host,” do not say “I opened the console.” Say: “I prove the sensor with Endpoint Inventory Last agent status reported, the alert with Workbench Status + Score + Model name, the event with XDR Data Explorer Data source / processor + Log type, the filter with Observed Attack Techniques Detection filter, and the switch with Detection Model Status or XDR for Endpoints (EDR).”
2. Mental model — five proof tools
Memorise five named objects before you click. Each tool is allowed to prove one thing. Over-claiming a field is how you isolate a host that Vision One never saw, or hunt a Workbench ID that a filter was never going to create.
1 · Endpoint Inventory
Endpoint Security → Endpoint Inventory. Proves the agent is (or is not) talking: Last agent status reported, product family, Sensor disabled vs Unmanaged. Does not prove a Workbench case.
2 · Workbench
Agentic SIEM and XDR → Workbench (Insights / All Alerts). Proves a correlated or standalone alert: Workbench ID, Status, Score, Model name. Empty list is data.
3 · XDR Data Explorer
Agentic SIEM and XDR → XDR Data Explorer. Proves events exist: Data source / processor + Log type (Detection / Telemetry / System) + Investigate host or Search Event UUID. Confirm query fields in your tenant.
4 · Observed Attack Techniques
Agentic SIEM and XDR → Observed Attack Techniques. Proves a filter fired: Event severity, Detected time, Detection filter, Tactic / Technique ID. Official: OAT events might not generate a Workbench insight or alert.
5 · Policy
Detection Model Management (Status, severity, applicable products) and Endpoint Security Policies (Endpoint security policy, XDR for Endpoints (EDR)). Proves the switch was on.
Hard words, once
Sensor disabled = sensor installed but not enabled via sensor or policy settings. Unmanaged = discoverable, no protection or sensor agent. Score = model severity + impact scope (max 99 on alerts created after 18 Jan 2021). Isolate Endpoint is a Response Management task; restore is a second task.
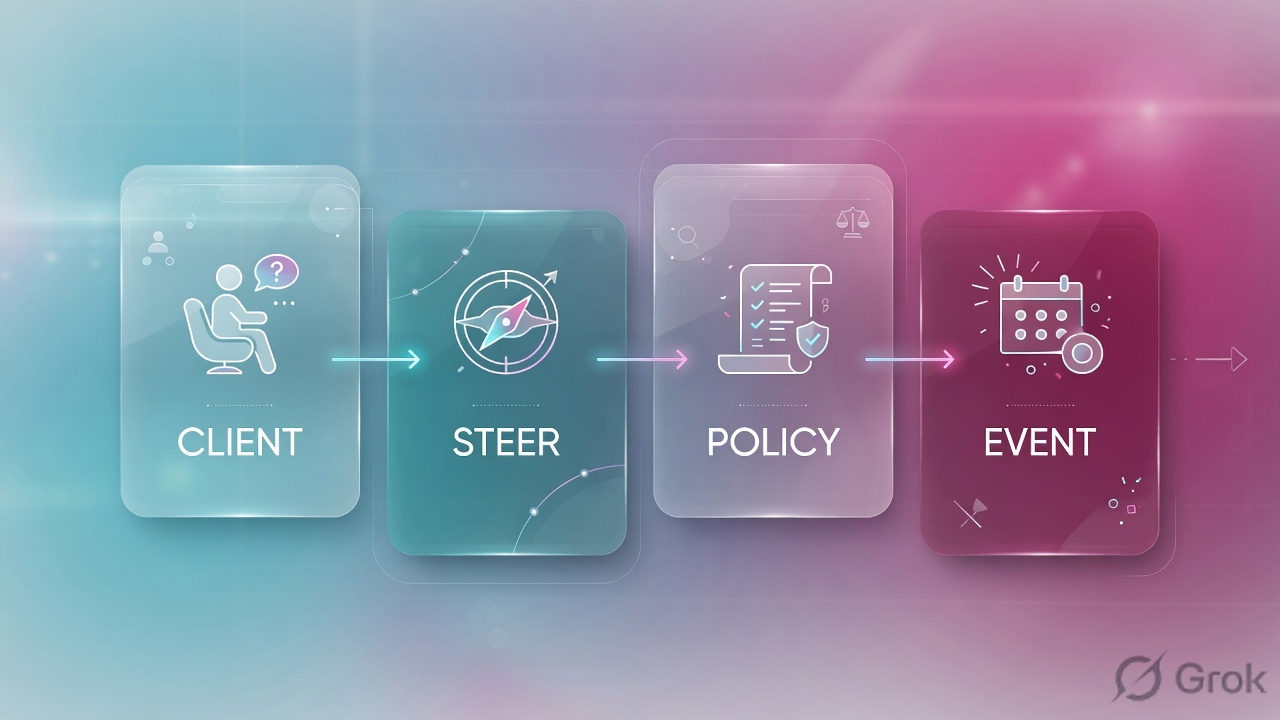
Read left → right. Each box is allowed one claim. If you cannot name the field, you are not proving — you are guessing.
I prove the sensor, then the Workbench alert, then the XDR event, then the OAT filter, then the policy switch. I do not isolate, disable a model, or open CREM until I can quote the field that made me do it.
3. Decision flow — ticket → first tool
Flowchart first. Do not open Isolate Endpoint or Detection Model Management until a diamond says so.
Read the diamond first. “No Workbench, host looks dirty” never starts in Isolate Endpoint. “Expected empty after a policy change” never starts in CREM. Stale last-seen never starts in Model name.
4. How to choose — first tool + proof field
Print this next to the Vision One console. If you cannot recite the proof field, you are not ready to isolate or tune anything.
| If the ticket says… | First tool (official path) | Proof field | Do not open first |
|---|---|---|---|
| “Is Vision One seeing this laptop / server?” | Endpoint Security → Endpoint Inventory | Last agent status reported + product family (Standard Endpoint Protection / Server & Workload / Sensor only / Connected Endpoint Protection) + Available Action (Sensor disabled vs Unmanaged) |
A new Isolate Endpoint, CREM |
| Workbench ID already on the ticket (High / New / Open) | Agentic SIEM and XDR → Workbench → All Alerts (or Insights) | Workbench ID + Status (Open / In progress / Closed) + Score + Model name |
Detection Model Management |
| Need the process / Event UUID behind a Workbench highlight | Agentic SIEM and XDR → XDR Data Explorer | Data source / processor + Log type (Detection events / Telemetry events / System events) + Investigate host or Search Event UUID hits |
A global exception |
| “Why no Workbench alert?” host still looks dirty | Agentic SIEM and XDR → Observed Attack Techniques | Event severity + Detected + Detection filter (+ Tactic ID / Technique ID). Official: OAT events might not generate a Workbench insight or alert |
Isolate Endpoint |
| Empty Workbench after a model or EDR change; expected silence | Detection Model Management and/or Endpoint Security Policies | Model Status (whether Vision One triggers the alert) + Endpoint security policy + XDR for Endpoints (EDR) enabled/disabled |
A new Workbench hunt |
Trend Vision One Online Help on Observed Attack Techniques: events listed there might not generate a Workbench insight or Workbench alert. Detection models are built from granular predefined or custom detection filters. A filter fire is not a correlated alert. Quote the Detection filter. Do not invent a missing Workbench ID, and do not Isolate Endpoint from an OAT row alone.
5. Runbook Side A → B → C
Side A proves the sensor is talking. Side B proves the Workbench alert and the XDR event. Side C proves the filter and the policy switch. On a messy Sev-2, do them in this order until a field lights up.
Side A — Endpoint Inventory (the sensor)
Primary source: Endpoint Inventory and Endpoint Inventory table columns.
-
Open Endpoint Inventory, not Workbench
Path: Endpoint Security → Endpoint Inventory. Filter the hostname on the ticket. Quote the product family under Security Deployment: Standard Endpoint Protection, Server & Workload Protection, Sensor only, or Connected Endpoint Protection.
-
Read the two columns that close a “seeing this?” ticket
Last agent status reported— the last time the agent connected (range plus exact timestamp). Official columns retiredSensor last connected/Sensor connectivityin favour of this field. AddIsolation statusso you know whether Isolate Endpoint already ran. -
Name the Available Action if the host is sick
Immediate action required — issue needs user intervention. Unmanaged endpoints — discoverable, no protection or sensor agent. Sensor disabled — sensor installed but not enabled via sensor or policy settings. Sensor update recommended — older Endpoint Sensor (including Activity Monitoring and Apex One Endpoint Sensor). Those four labels are official Available Actions wording.
-
If last-seen is stale, stop
A Workbench story on a host whose last status is five days old is a sensor ticket, not an isolate debate. Isolation commands sit in Response Management as Queued when the agent is offline. Fix check-in first.
Endpoint Security / Endpoint Inventory / SENSOR-LAB-17
Endpoint details · SENSOR-LAB-17
Sensor disabled — sensor installed, not enabled via sensor or policy settings
Unmanaged endpoints — discoverable, no protection or sensor agent
Source: Trend Vision One Online Help — Endpoint Inventory; Endpoint Inventory table columns (Last agent status reported, Isolation status, Endpoint security policy, XDR for Endpoints (EDR)). Lab host only. Training mock · not live.
Side B — Workbench and XDR Data Explorer
Primary source: Workbench, Alert details, XDR Data Explorer.
-
Open Workbench, not CREM
Path: Agentic SIEM and XDR → Workbench. Workbench insights is the high-priority correlated-alert view (filter by Severity and score, Case status). All Alerts is the full standalone-alert list for root-cause and impact. Click the Workbench ID.
-
Read the four fields that identify the alert
Workbench ID.Status— Open (new, not under investigation), In progress, Closed.Score— overall severity from matched-model severity plus impact scope (maximum 99 for alerts created after 18 January 2021).Model name+Model severity+Impact scope+Data source / processor. Official Help format note (Success KA-0015503):WB-<company>-<date created>-<order of WB per day>. Lab label on this page staysWB-1042. -
Use Highlights, then Search Event UUID
Investigate an alert: Highlights lists the detection filters that triggered it. Every event starts with the filter name. Click Search Event UUID to open a new XDR Data Explorer query for that event. Right-click objects for the context menu (Isolate Endpoint is here only after the fields above exist).
-
Prove the event in XDR Data Explorer
Path: Agentic SIEM and XDR → XDR Data Explorer. Select Data source / processor and Log type — All, Detection events, Telemetry events, or System events — then Run query. Or use Investigate host with hostname / IP. Quote source + log type + hit count + time. Confirm live query field names in your tenant; do not invent columns from memory.
Agentic SIEM and XDR / Workbench / All Alerts / WB-1042
Alert details · WB-1042
| Filter | Technique | Data source | Detected |
|---|---|---|---|
| Volume shadow copy deletion | T1490 | Standard Endpoint Protection | 20:38 UTC |
| Suspicious process chain | T1059 | Standard Endpoint Protection | 20:37 UTC |
Source: Trend Vision One Online Help — Workbench; All Alerts; Alert details (Status, Score, Workbench ID, Model name, Impact scope, Data source / processor, Highlights). Lab identities only. Next click: Search Event UUID in XDR Data Explorer.
Side C — Observed Attack Techniques and policy
Primary source: Observed Attack Techniques, Detection Model Management, Success KA-0015503.
-
If Workbench is empty, open OAT — do not isolate
Path: Agentic SIEM and XDR → Observed Attack Techniques. Filter Event severity and last Detected time. Add filter: Asset group, Custom tag, Data source / processor, Detection filter, Endpoint group, Tactic ID, or Technique ID. Search box: endpoint or container name.
-
Quote the filter, then decide whether Workbench was ever going to fire
Expand the row. Official Help: OAT events might not generate a Workbench insight or alert. You may Query in XDR Data Explorer, View Event in XDR Data Explorer, or right-click Add to Workbench Insight. Adding an event updates impact scope and highlighted objects — it is not Isolate Endpoint.
-
If silence was expected, prove the switch
Detection Model Management (Agentic SIEM and XDR → Detection Model Management): review
Status(whether Vision One triggers alerts for that model),Severity, and Applicable products. You cannot enable a trigger when the required product is not connected. Defaults: Vision One enables supported models as you add products. -
If the host is present but EDR is off, quote the policy
Back in Endpoint Inventory, read
Endpoint security policy(the assignment in Endpoint Security Policies) andXDR for Endpoints (EDR)enabled/disabled. EDR off explains empty Detection events. Do not hunt a missing Workbench ID first. Scoped exceptions live under Detection Model Management → Exceptions — owner and expiry, not “turn Workbench off.”
Agentic SIEM and XDR / Observed Attack Techniques / SENSOR-LAB-17
Observed Attack Techniques
Events listed in Observed Attack Techniques might not generate a Workbench insight or Workbench alert.
Next: Query in XDR Data Explorer · or Add to Workbench Insight — not Isolate Endpoint.
Source: Trend Vision One Online Help — Observed Attack Techniques (Event severity, Detected, Detection filter, Tactic ID / Technique ID; OAT may not create Workbench). Lab host only.
- Side A: Endpoint Inventory names product +
Last agent status reportedin the ticket UTC window. Isolation status is Not isolated unless a Response Management task already succeeded. - Side B: Workbench ID + Status + Score + Model name on the case. XDR Data Explorer names Data source / processor + Log type + hits (or Search Event UUID).
- Side C: OAT Detection filter quoted when Workbench is empty. Model Status and/or XDR for Endpoints (EDR) quoted when silence was expected.
- Isolate Endpoint, if used, is a Response Management task (Pending approval / In progress / Queued / Successful / Unsuccessful). Restore connection is a later task on that isolate record.

6. Five tickets as full stories
Same five tools, written as night-shift stories. Lab host SENSOR-LAB-17 and lab alert WB-1042 match the factory. They are training labels, not a customer tenant.
| ID | Ticket | First tool | Proof field |
|---|---|---|---|
| TV1D-01 | WFH laptop: “Is Vision One even seeing this?” | Endpoint Inventory | Last agent status reported + product + Sensor disabled / Unmanaged |
| TV1D-02 | Workbench High Open on SENSOR-LAB-17 | Workbench All Alerts | Workbench ID + Status + Score + Model name |
| TV1D-03 | Need the event behind the highlight | XDR Data Explorer | Data source / processor + Log type + hits / Event UUID |
| TV1D-04 | “Why no Workbench?” host looks dirty | Observed Attack Techniques | Detection filter + Event severity (OAT ≠ Workbench) |
| TV1D-05 | Empty Workbench after an EDR / model change | Detection Model + Endpoint Security policy | Model Status and/or XDR for Endpoints (EDR) |
TV1D-01 — “Is Vision One seeing this laptop?”
02:11. Priya on hotel Wi-Fi. Slack screenshot of a spinning Office tab. Someone says “Trend is down.” First tool is not Workbench.
Do: Endpoint Security → Endpoint Inventory → her hostname. Quote Last agent status reported. If the row is missing, check Available Actions: Unmanaged endpoints means discoverable with no agent. Sensor disabled means the sensor is installed and the switch is off.
If last-seen is minutes ago and Standard Endpoint Protection is listed, Vision One is seeing the host. “No Workbench” is now a different ticket (TV1D-04 or TV1D-05). If last-seen is days old, stop. Isolate Endpoint will sit Queued in Response Management. That is a sensor ticket.
I do not trust a colleague’s Inventory row from a different hostname. The proof is Last agent status reported on the failing device. A green tray icon on her laptop is not this column.
TV1D-02 — Workbench High, status Open
Bridge already has WB-1042 in the title. First tool is Workbench, not Inventory — unless last-seen was never proved.
Path: Agentic SIEM and XDR → Workbench → All Alerts → click the ID. Proof field: Workbench ID, Status = Open, Score, Model name (lab: Possible ransomware staging), Impact scope = 1 endpoint, Data source / processor = Standard Endpoint Protection.
Change Status only after you have those four identity fields on the ticket. Findings stay “—” until the investigation actually has one (True positive / False positive / Benign true positive / Noteworthy / Other findings).
TV1D-03 — Prove the event, not the title
Highlights named a Volume shadow copy deletion filter. A title is not evidence. Do: Search Event UUID, or XDR Data Explorer → Investigate host = SENSOR-LAB-17, Log type = Detection events (then Telemetry events if Detection is empty).
Proof field: Data source / processor + Log type + at least one hit in the UTC window. If both Detection and Telemetry are empty while last-seen is fresh, you have a policy / EDR ticket (TV1D-05), not a missing isolate.
Confirm query syntax in the tenant. Saved queries store the string, not the results (cap 200). Export is a later evidence pack, not the first proof.
TV1D-04 — “Why no Workbench alert?”
IR chat: “vssadmin ran, why is Workbench empty?” Empty Workbench is allowed. Official OAT Help says those events might not generate a Workbench insight or alert.
First tool: Observed Attack Techniques. Filter endpoint name + last Detected. Proof field: Detection filter + Event severity + Technique ID. Next click is Query in XDR Data Explorer or Add to Workbench Insight — not Isolate Endpoint, not “Trend is broken.”
Success KA-0015503: if you clicked View Event from an old Workbench ID and OAT is empty, XDL data are kept about 30 days. Read the date out of the official Workbench ID format before you declare the filter dead.
TV1D-05 — Expected silence after a policy change
Change window an hour ago. Someone disabled XDR for Endpoints (EDR) on Lab-Standard-EDR, or turned a model Status off, and now Finance asks why Workbench is quiet.
First tool: Detection Model Management for the named model (Status, Severity, Applicable products). Then Endpoint Inventory → Endpoint security policy + XDR for Endpoints (EDR). Quote the switch. Do not hunt a Workbench ID that the switch cannot create.
Daily noise is the inverse ticket: tune or add a scoped exception with owner and expiry. Do not disable the Workbench app. Success KA-0015503 documents wildcard exception escaping for Workbench / OAT — that is a change-control task, not a night-shift disable.
Isolate Endpoint is a Response Management task after Side A + B exist. Official task statuses: Pending approval, Rejected, In progress, Queued (agent offline), Successful, Unsuccessful. Task status means the managing server received the command — not that the Security Agent finished it. Restore connection is a second task on that isolate record. Critical endpoints can be excluded from response actions; isolated infrastructure can get inbound/outbound exceptions. None of that answers “is Vision One seeing this?”
7. Traps + close-the-ticket proof
Every trap is a wrong first tool. The fix is always one official field on a timestamp.
| What you saw | Wrong first move | Proof that closes |
|---|---|---|
| Empty Workbench | “Trend is down” / Isolate Endpoint | Endpoint Inventory last-seen, or OAT Detection filter, or model Status / EDR off |
| Sensor disabled | Hunt Workbench Model name | Available Actions: sensor installed, not enabled via sensor or policy settings |
| Unmanaged | Response Management isolate | No protection or sensor agent — deploy, do not isolate |
| OAT High, no Workbench ID | Declare a missed Sev-1 | Official: OAT might not generate Workbench; quote Detection filter |
| Workbench ID older than ~30 days, OAT empty | “Filter is dead” | Success KA-0015503 — XDL retention; read the date in the Workbench ID |
| Last-seen 5 days | Isolate anyway | Response task will be Queued; fix the sensor |
| XDR for Endpoints (EDR) disabled | New Workbench hunt | Endpoint security policy + EDR column |
| High CREM tile | Page SOC / isolate | Wrong desk — that is the factory (Workbench vs CREM) |
| Daily Workbench noise | Disable Workbench | Model tune or scoped exception, owner + expiry |
| Isolate Successful in Response Management | “The agent executed it” | Official: task status is managing-server receipt, not agent finish |
- UTC window written next to the tool you opened.
- Hostname matches Endpoint Inventory
Endpoint name(and Endpoint GUID if two hosts share a name). - One first tool. One proof field. No second Allow, no second isolate, no CREM page from this desk.
- If you isolated: Response Management Action = Isolate Endpoint + task status. Restore plan named.
- If you tuned: Detection Model Status or exception owner + expiry. Workbench app still on.
I name the question, then the first tool, then one official field. Endpoint Inventory proves the sensor. Workbench proves the correlated or standalone alert. XDR Data Explorer proves the event. Observed Attack Techniques proves the filter — and official Help says that filter might never become a Workbench ID. Policy proves the switch. I do not isolate, disable a model, or open CREM until that field is on the ticket. Queue model: Workbench vs CREM factory.
Knowledge check
Six night-shift judgments. Each maps to a first tool or a proof field. Check answers, then Reset if you picked the wrong surface.
Sources
- Trend Vision One Online Help — platform map: Agentic SIEM & XDR (Workbench, XDR Data Explorer, Observed Attack Techniques, Detection Model Management), Endpoint Security
- Endpoint Inventory — Available Actions (Immediate action required, Unmanaged endpoints, Sensor disabled, Sensor update recommended); Security Deployment product families; Isolate Endpoint / Restore connection
- Endpoint Inventory table columns —
Last agent status reported,Isolation status,Endpoint security policy,XDR for Endpoints (EDR), agent / sensor versions - Workbench — Agentic SIEM and XDR → Workbench; Insights vs All Alerts
- Workbench insights — Severity and score; Case status filters
- All Alerts — Status, Findings, Model name / type, Change Status, Assign Owner
- Alert details — Status (Open / In progress / Closed), Score (max 99 after 18 Jan 2021), Workbench ID, Model name, Model severity, Impact scope, Data source / processor, Findings, Highlights
- Investigate an alert — Highlights filters, Search Event UUID, Observable Graph, context menu
- XDR Data Explorer — Agentic SIEM and XDR → XDR Data Explorer; Data source / processor; Log type (Detection / Telemetry / System events); Investigate host
- Observed Attack Techniques — Event severity, Detected, Detection filter, Tactic / Technique ID; OAT events might not generate Workbench
- Detection Model Management — Status, Severity, Applicable products; models that trigger Workbench alerts
- Detection model / filter exceptions — Detection Model Management → Exceptions
- Endpoint security policy overrides — per-endpoint overrides from Inventory
- Isolate Endpoint task — context menu; Response Management statuses; Restore connection is a later task
- Restore Connection task
- Success Center KA-0015503 — Workbench App FAQs — Workbench ID format; OAT empty after View Event (~30-day XDL); wildcard exceptions; iES-off models can still fire from detection logs
- Success Center KA-0014914 — Endpoint Sensor Data — console location Endpoint Security Operations → Endpoint Inventory
Related: Blog 1 · Workbench vs CREM factory · Trend Vision One interview hub · Dummy lab