Computers & Servers answers “is this device online and what is its protection health?” Threat Analysis Center → Detections answers “did XDR/MDR see unusual activity that was not blocked?” Log viewer answers “which SFOS module and which fw_rule_id took this session?” SD-WAN / IPsec status answers “is the site path up, and does it meet SLA?” Policies tab on the computer answers “which endpoint policy is actually assigned?” A green shield icon is not a health column. An Accept rule is not an ESTABLISHED session. A Base Policy existing in the list is not the policy on this laptop.
1. Why “is it working?” is five questions
Operators collapse five failures into one sentence. The laptop never checked in. XDR never uploaded to the Data Lake. The firewall rule never logged. The SD-WAN gateway failed SLA while the link still looked up. The Peripheral Control policy never attached to that computer. Those are five first clicks.
This page is the night-shift desk for proof. The factory taught the SFOS session — Accept is not ESTABLISHED. Here you learn the five tools you actually open, in order, when someone asks you to prove Sophos is working. Central and XGS/SFOS are one estate. They are not one log store.
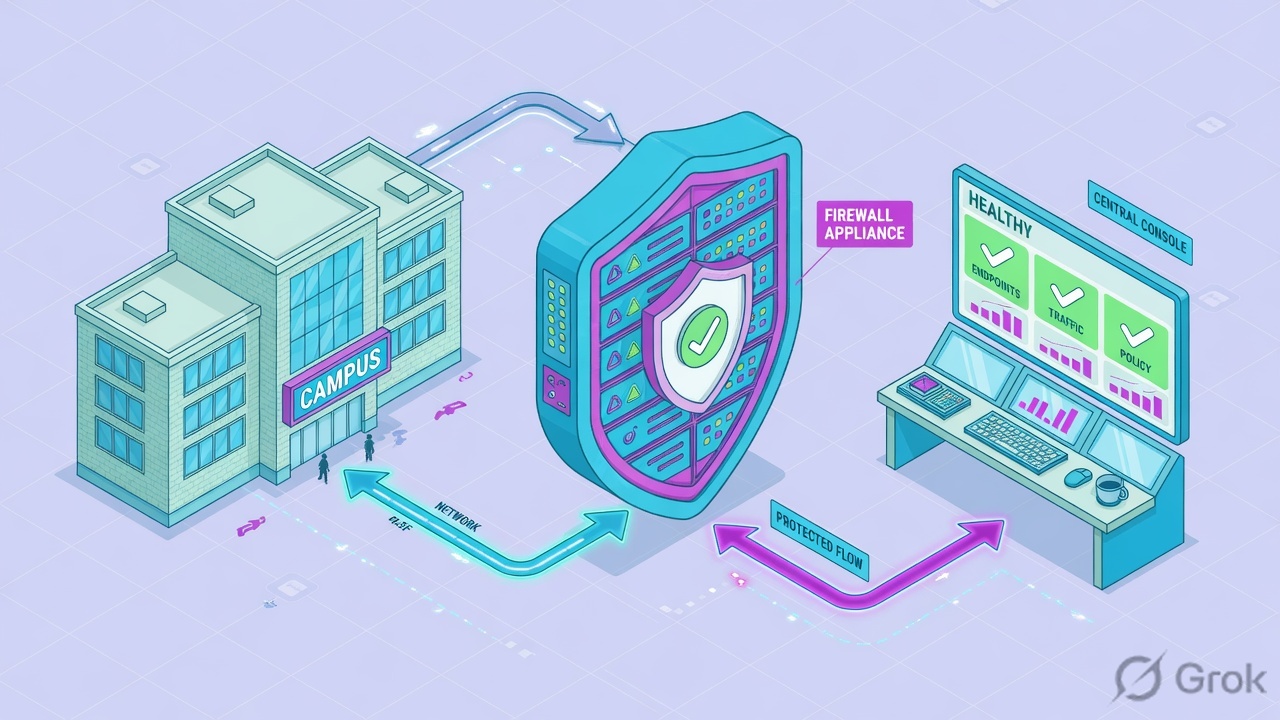
If they say “prove Sophos is working,” do not say “I opened Central.” Say: “I prove the device with Computers & Servers Health status + Last active, the hunt with TAC Detection + Entity, the session with Log viewer log_type + fw_rule_id, the site path with SD-WAN Active or IPsec Connection, and the assigned control with the computer’s Policies tab.”
2. Mental model — five proof tools
Memorise five named objects before you click. Each tool is allowed to prove one thing. Over-claiming a field is how you ship a bad change at 02:00.
1 · Devices / protection
Central My Environment → Computers & Servers. Proves Health status (Good / Warning / Bad / Unknown) and Last active (Online or last contact). Does not prove a firewall rule or a TAC detection.
2 · TAC Detections
Central Threat Analysis Center → Detections. Proves unusual or suspicious activity that was not blocked: Severity + Detection + Entity. Needs EDR, XDR, or MDR. Not the same as a blocked Event.
3 · Log viewer
XGS/SFOS Log viewer (upper-right of any admin page). Proves one session: module + log_type + fw_rule_id. Empty means logging is off or the session never Destroyed — not “Sophos is down.”
4 · SD-WAN / VPN
SFOS Routing → SD-WAN routes (hover Active) or Site-to-site VPN → IPsec (Active vs Connection). Central map: Firewall Management → SD-WAN Connection Groups (green / orange / red).
5 · Policy assigned
Computer details → Policies tab. Official: go to Computers, click the name, look in Policies. Proves which policy actually applies. A Base Policy in the list is not this laptop’s assignment.
Hard words, once
Health status = Good / Warning / Bad / Unknown on the device list. Detection = Data Lake match that was not blocked. fw_rule_id = the firewall rule number in Log viewer. Active ≠ Connection on IPsec. SLA isn’t met can still be In use.
Read left → right. Each box is allowed one claim. If you cannot name the field, you are not proving — you are guessing.
I prove the device, then the detection, then the firewall session, then the site path, then the assigned policy. I do not add an Accept, isolate a fleet, or bounce IPsec until I can quote the field that made me do it.
3. Decision flow — ticket → first tool
Flowchart first. Do not open the policy editor until a diamond says so.
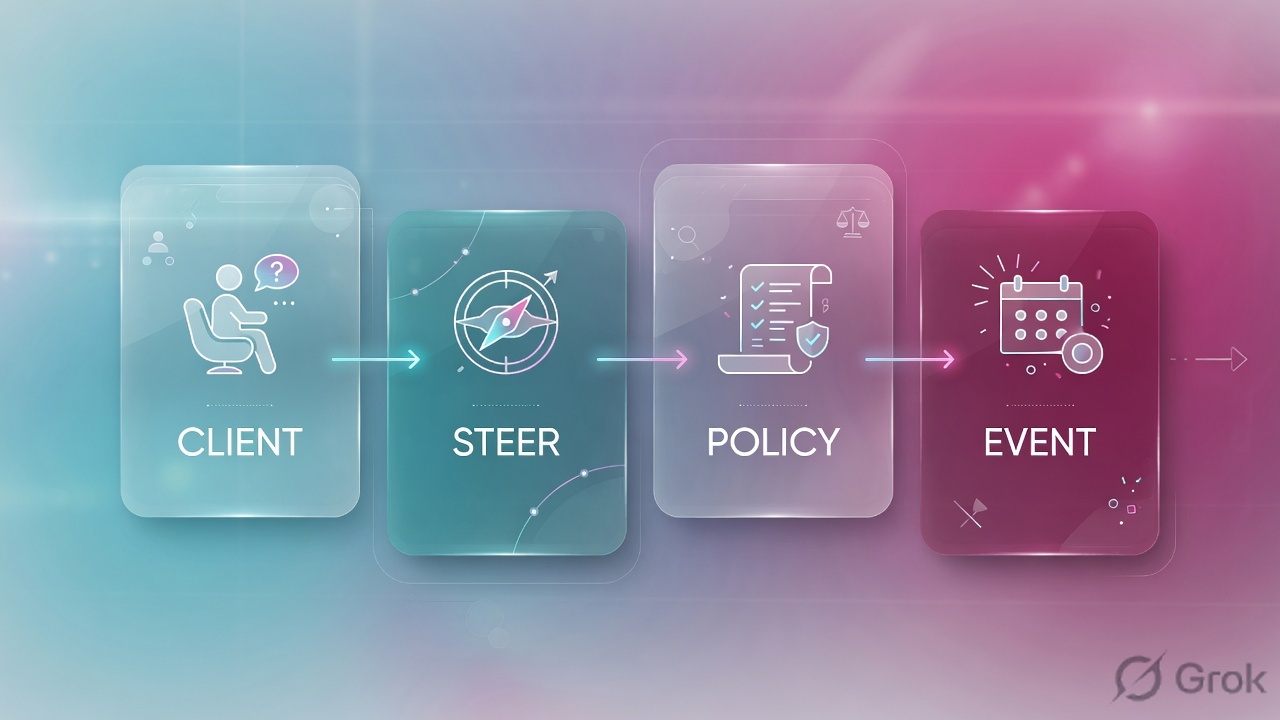
Read the diamond first. Unusual-not-blocked never starts in Log viewer. Whole-site-dead never starts in a new Accept. Offline Last active never starts in TAC Detections.
4. How to choose — first tool + proof field
Print this next to Central and the XGS admin tab. If you cannot recite the proof field, you are not ready to change anything.
| If the ticket says… | First tool (official path) | Proof field | Do not open first |
|---|---|---|---|
| Laptop / hotel / “is Sophos even installed?” | Central My Environment → Computers & Servers (or My Products → Endpoint → Computers) | Health status (Good / Warning / Bad / Unknown) + Last active (Online or last contact) |
A new firewall Accept |
| “Sophos missed it” / unusual activity / living-off-the-land | Central Threat Analysis Center → Detections | Severity + Detection (name) + Entity + Time |
Log viewer Firewall module |
| One SaaS / URL blocked or allowed after a rule change | XGS Log viewer → module Firewall (or Content filtering) | log_type + fw_rule_id (+ log_subtype / status Allow or Deny) |
A second Accept above the stack |
| Whole branch internet dead, or “VPN is up but apps die” | SFOS Routing → SD-WAN routes (hover Active) or Site-to-site VPN → IPsec | Gateway status (In use / Available / Unavailable / SLA isn’t met) or IPsec Connection established | A Cloud / web policy edit |
| USB / web / threat setting “should have blocked” | Computer details → Policies tab | The named policy actually assigned to that computer (not merely present in the list) | Isolate the fleet / Reset health status |
Sophos Central: detections identify activity that is unusual or suspicious but has not been blocked. Events are where Sophos already detected and blocked something known-malicious. If the ticket is “Intercept X popped a block,” start at the computer’s Events / Alerts, not TAC Detections. If the ticket is “nothing blocked but this command line looks wrong,” start at Threat Analysis Center → Detections. You need EDR, XDR, or MDR for Detections.
5. Runbook Side A → B → C
Side A proves the endpoint is present and which policy it carries. Side B proves the hunt (TAC). Side C proves the XGS path (Log viewer, then SD-WAN / IPsec). On a messy Sev-2, do them in this order until a field lights up.
Side A — Devices + policy assigned (Central)
-
Open the device list, not the policy editor
Path: My Environment → Computers & Servers. Official: Computers and servers. Older muscle memory still works: My Products → Endpoint → Computers. Filter Device name or search Name / OS / IP / Tag. Quote
Health statusandLast active. -
Read protection, not the tray icon
On the list:
Health statusGood / Warning / Bad / Unknown.Last activeshows a green dot and Online, or a gray dot and the last contact time. Also quote Agent mode (Endpoint / XDR / XDR Sensor) and Tamper protection (On / Off / Not applicable). XDR Sensor is detection-and-response only — official warning: Sophos will not install anti-malware protection on that mode. -
Open Status if you need overall health
Click the computer name → Status tab. Official: Computer Status. Windows shows Overall health plus assessments: Communication, Operations, Services, System, Threat, Update. Each is Good / Warning / Bad / Info. Summary-tab health can differ from the list — Sophos documents that gap. Do not “Reset health status” as a close; a reset clears alerts, it does not clean threats.
-
Prove which policy is assigned
Same computer → Policies tab. Official Set up policies / About Policies: go to Computers, click the name, look in the Policies tab. That is the assignment. The My Products → Endpoint → Policies list only shows what exists and in which order. Base Policy always sits at the bottom and applies if nothing higher matches.
My Environment / Computers & Servers
Computers & Servers
| Health | Name | Last active | Agent mode | Tamper protection |
|---|---|---|---|---|
| Good | laptop-blr-12 | Online | XDR | On |
| Warning | laptop-pune-07 | Online | Endpoint | On |
| Unknown | laptop-hotel-03 | Yesterday 18:12 UTC | Endpoint | On |
Source: Sophos Central Admin — Computers and servers (Health status, Last active, Agent mode, Tamper protection). Lab hostnames only. Training mock · not live.
Computers & Servers / laptop-pune-07 / Policies
Policies applied to this computer
Peripheral Control = Base Policy — not PC-Block-USB-Finance.
Threat Protection = TP-Standard-Windows (assigned, turned on).
Source: Sophos Central Admin — Set up policies; About Policies (Policies tab on the computer’s details page). Lab policy names only. Training mock · not live.
Side B — Threat Analysis Center / Detections
-
Confirm you are allowed to see detections
Official: you must have Sophos EDR, XDR, or MDR. Devices must upload to the Data Lake (Data Lake uploads). No upload → empty Detections is expected, not “Sophos missed it.”
-
Open Detections, not Cases first
Path: Threat Analysis Center → Detections. Official: Detections. Set the time range (commonly last 24 hours, or Absolute date range to the ticket UTC). Filter Entity / device name. Optionally Group by Detection ID.
-
Quote Severity, Detection, Entity, Time
List columns documented:
Severity,Type(Threat or Vulnerability),Detection,Time,Entity,Category(Endpoint, Network, Firewall, Email, Cloud, ID provider, Platform),Source,MITRE ATT&CK. Click the row for the slide-out. That name + entity + timestamp is the ticket. Cases group detections later — do not skip the raw detection.
Threat Analysis Center / Detections
Detections
| Severity | Type | Detection | Entity | Category | MITRE |
|---|---|---|---|---|---|
| High | Threat | Suspicious PowerShell encoded command | laptop-pune-07 | Endpoint | TA0002 Execution |
| Low | Vulnerability | Browser out of date | laptop-pune-07 | Endpoint | — |
Source: Sophos Central Admin — Detections (path, columns, EDR/XDR/MDR requirement). Lab detection names only. Training mock · not live.
Side C — Log viewer + SD-WAN / VPN (XGS / SFOS)
-
Confirm the session can log
Two official switches. On the firewall rule: Log firewall traffic. On System services → Log settings: select Firewall (and SD-WAN if that is the ticket) under Local reporting so Log viewer can show it. Web-policy events also need Log firewall traffic on the associated rule. Source: Log settings; Logs.
-
Open Log viewer and pick the module
Click Log viewer in the upper-right of any SFOS page — it opens a full-screen window. Official: Log viewer. Use the module drop-down (Firewall, SD-WAN, Content filtering, Heartbeat, …). Add filter: field + condition + value. Free text search also works for ports, IPs, usernames, or rules.
-
Quote log_type and fw_rule_id
Syslog / Log viewer detail fields:
log_type,log_component,log_subtype,fw_rule_id, status (Allow / Deny / Allow Session / Deny Session).log_idis a twelve-character code (type + component + subtype + priority + message). Example from official docs:010101600001→ type 01 Security policy, component 01 Firewall rule, subtype 01 Allowed. Default Drop all is ruleID 0. -
If the whole site is dead, switch to status — not another rule
SD-WAN: Routing → SD-WAN routes. Hover the icon under Active. Profile statuses: In use, Available, Unavailable, In use but SLA isn’t met, Available and SLA isn’t met. IPsec: Site-to-site VPN → IPsec. Two different columns — Active (on/off) and Connection (established / not / partial). Central map: My Products → Firewall Management → SD-WAN Connection Groups (green all active, orange at least one inactive, red all inactive).
Log viewer / Module: Firewall / Add filter
Firewall logs
| log_type | log_subtype | fw_rule_id | dst | status |
|---|---|---|---|---|
| Firewall | Allowed | 12 | outlook.office.com | Allow |
| Firewall | Denied | 27 | attachment host | Deny |
log_type="Firewall" log_component="Firewall Rule" log_subtype="Denied"
fw_rule_id=27 src_ip=203.0.113.40 dst_port=443
Source: Sophos Firewall — Log viewer; Log settings; Syslog guide (log_type, fw_rule_id, status). RFC 5737 lab address. Training mock · not live.
Device:     My Environment → Computers & Servers
            Health status + Last active + Agent mode
Hunt:       Threat Analysis Center → Detections
            Severity + Detection + Entity + Time
Session:    Log viewer → module Firewall
            log_type + fw_rule_id (+ log_subtype)
Path:       Routing → SD-WAN routes → Active
            or Site-to-site VPN → IPsec → Connection
Policy:     computer → Policies tab
named policy actually assigned- Side A device: Computers & Servers shows the hostname,
Last active= Online, and a namedHealth status. Side A policy: Policies tab names the assigned policy, not just Base Policy in the list. - Side B: a Detections row names
Severity+Detection+Entityin the ticket UTC window — or you can say “no Data Lake upload / no EDR licence,” which is also a close. - Side C session: Log viewer row names
log_type+fw_rule_id. Side C path: SD-WAN Active is In use and SLA met, or IPsec Connection is established (not merely Active).
Firewall rules log a session when the firewall receives a connection Destroy event. It does not log sessions closed without Destroy — official example: loss of internet connectivity. SSL/TLS logs after the handshake completes and when the connection closes. If the site just died, empty Firewall logs are expected. Switch to SD-WAN / IPsec status, then to SD-WAN module logs (after you select SD-WAN under Log settings).
6. Five tickets as full stories
These five land every quarter. Memorise first tool + proof field. Times and identities below are lab-only.
| Ticket | Symptom | First tool | Proof field |
|---|---|---|---|
| SED-01 | WFH laptop: “internet is broken, Sophos is down” | Computers & Servers | Health status + Last active |
| SED-02 | “Sophos missed the PowerShell” — nothing blocked | TAC Detections | Severity + Detection + Entity |
| SED-03 | After a 02:00 rule change, attachments fail; page loads | Log viewer · Firewall | log_type + fw_rule_id |
| SED-04 | Pune branch dead since a peer change; Firewall log empty | SD-WAN Active / IPsec Connection | Gateway status or Connection established |
| SED-05 | USB should have been blocked; it was not | Policies tab on that computer | Assigned Peripheral Control policy name |
SED-01 — Prove the device (Computers & Servers)
01:42 · P2. Priya on a hotel network. Phone photo of a green shield. L1 already drafted a new WAN Accept.
First tool: My Environment → Computers & Servers. Search laptop-pune-07 (lab).
If Last active is not Online: quote the last contact time. There is no firewall row to hunt for that laptop. Next check is agent check-in — offline, deleted, expired licence, or never installed — not a new Accept. Official: inactive devices show a gray dot and the last date/time they contacted Central.
If Online: quote Health status. Then you are allowed to open Status, Events, or Log viewer for her user/IP. The tray icon is not Health status.
Do not trust a colleague’s Central view of a different device. The proof is this hostname. Summary-tab health can differ from the list (official). Reset health status is not a close — it clears alerts; broken installs stay Bad; offline devices do not change.
SED-02 — Prove the hunt (TAC Detections)
02:05 · P2. Helpdesk: “Sophos missed it — nothing popped.” Someone wants Adaptive Attack Protection on the whole OU.
First tool: Threat Analysis Center → Detections. Time range = ticket window. Filter Entity = laptop-pune-07.
Proof field: a High Detection name on that Entity at that Time — or a clean empty list after you confirmed Data Lake upload + EDR/XDR/MDR. Detections are the not-blocked class. If Intercept X already blocked, that is an Event on the device, not a Detection miss.
I would not isolate the fleet from a Slack adjective. I would paste Severity + Detection + Entity + Time, or write “no Data Lake upload.” Sophos Support will not investigate detections for you — official. MDR is the paid 24/7 path.
SED-03 — Prove the session (Log viewer)
02:20 · P2. Outlook Web opens. Attachments fail after last night’s rule ship. L1 wants “another Accept for outlook.office.com.”
First tool: XGS Log viewer → module Firewall (and Content filtering if the web policy is in play). Filter src_ip + last hour. Confirm Log firewall traffic is on that rule.
Proof field: page host log_subtype Allowed on fw_rule_id=12; attachment host Denied on fw_rule_id=27. That ID is the ticket. Change that one rule — or its web policy — then re-read the same two fields. Automatically created rules (MTA, IPsec, hotspot) land at the top and steal match; official: review positions after auto-create.
I would not add a second Accept. I would quote fw_rule_id on the Denied row. A new rule at Top is not proof until the same filter returns Allowed on a later Destroy.
SED-04 — Prove the site path (SD-WAN / VPN)
02:40 · P1. Pune branch: every desk lost internet after a 02:00 peer change. Firewall Log viewer for that src subnet is empty. L1 wants a Force-allow any-any.
First tool: Routing → SD-WAN routes — hover Active. Or Site-to-site VPN → IPsec — read Connection, not only Active.
Proof field: gateway Unavailable, or In use, but SLA isn’t met (latency / jitter / packet loss), or IPsec Active but Connection not established (or partial — one subnet pair down). Empty Firewall logs match the official Destroy caveat when the WAN just died. Central map: Firewall Management → SD-WAN Connection Groups orange/red is the estate view, not the hop.
Active IPsec is not an established tunnel. In use is not SLA met. If profile gateways are down, SFOS evaluates other SD-WAN routes and may fall through to the default WAN link load-balancing route — official. Quote the status, then restore the peer. Do not stack Accept on an empty log.
SED-05 — Prove the assigned policy (Policies tab)
03:00 · P3. Finance USB “should have been blocked.” Peripheral Control policy PC-Block-USB-Finance exists and is turned on. Someone wants Tamper protection off so they can “push again.”
First tool: Computers & Servers → that computer → Policies tab.
Proof field: Peripheral Control = Base Policy (lab) — the blocking policy never assigned to this device or user. Official: a user policy covers every device that user has; a device policy covers the computer regardless of who signs in; if both could apply, the higher list item wins. Base Policy is always last.
I would leave Tamper protection On. I would paste the Policies tab. Assign the computer (or the signed-in user) to PC-Block-USB-Finance, put that policy above Base Policy, wait for check-in, then re-read the same tab. Existence in the Policies list is not assignment.
7. Traps + close-the-ticket proof
| You see | Weak close | Strong close |
|---|---|---|
| Last active not Online | “Sophos is down” / new Accept | Quote last contact; fix agent check-in; reload Computers & Servers |
| Online + Good, still failing | “Sophos is fine” | You only proved the device. Open Log viewer or Policies tab for that ticket. |
| Green tray icon | “Protection is working” | Quote list Health status + Agent mode. XDR Sensor has no anti-malware. |
| Empty Detections | “XDR missed it” | Licence + Data Lake upload first. Or the activity was a blocked Event, not a Detection. |
| Empty Log viewer | A Cloud / web policy blocked everything | Log firewall traffic + Log settings Local reporting; or Destroy never arrived — check SD-WAN / IPsec |
| IPsec Active | “Tunnel is up” | Read Connection established / partial / not established |
| SD-WAN In use | “Path is fine” | Hover Active — “SLA isn’t met” is still a failure |
| Policy exists in the list | Turn Tamper protection off | Policies tab on that computer — assigned name + order |
| Reset health → Good | Ticket closed | Official: reset does not clean threats; Bad returns if issues remain |
- UTC window written next to the tool you opened.
- Device proved on the failing hostname (
Health status+Last active) when the ticket is “is Sophos even working?” - One object quoted: TAC
Detection+Entity, or Log viewerlog_type+fw_rule_id, or SD-WAN / IPsec status, or Policies-tab assignment. - Next tool named — or change-control owner named. No new Accept without residual control.
- Peer or second host compared when you claim “not an estate outage.”
- Empty Log viewer not used as “Sophos blocked the internet.”
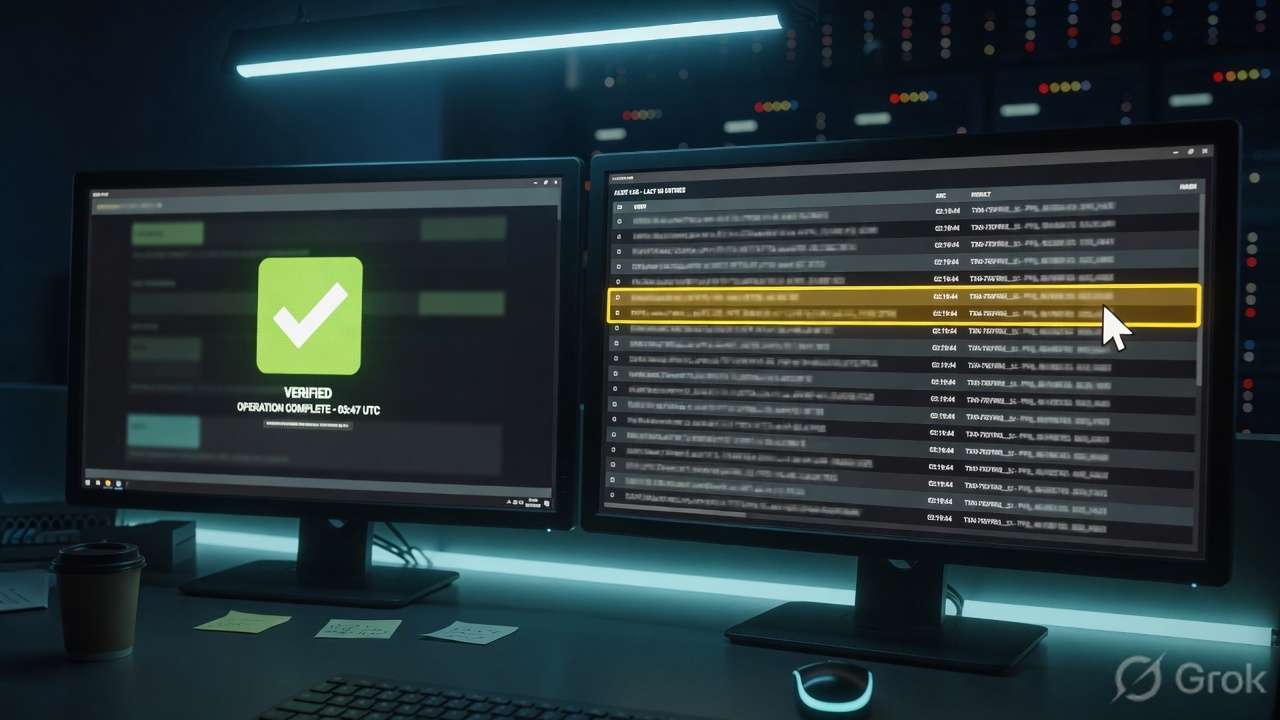
I name the question, then the first tool, then one official field. Computers & Servers proves the device. TAC Detections proves the not-blocked hunt. Log viewer proves the session (log_type + fw_rule_id). SD-WAN / IPsec proves the site path. The Policies tab proves assignment. I do not add an Accept, isolate a fleet, or bounce IPsec until that field is on the ticket. Factory model: Sophos session factory — SYN_SENT after accept.
Knowledge check
Six night-shift judgments. Each maps to a first tool or a proof field. Check answers, then Reset if you picked the wrong surface.
Sources
- Sophos Central Admin — Computers and servers (
Health status,Last active,Agent mode,Tamper protection, Reset health status) - Sophos Central Admin — Computer Status (Status tab; Overall health; Communication / Operations / Services / System / Threat / Update)
- Sophos Central Admin — Computer Summary (security health icons; Actions; Agent Summary)
- Sophos Central Admin — Set up policies (My Products → Endpoint → Policies; Computers → Policies tab)
- Sophos Central Admin — About Policies (Base Policy; user vs device; list order; Policies tab)
- Sophos Central Admin — Detections (Threat Analysis Center → Detections; columns; EDR/XDR/MDR; not-blocked definition)
- Sophos Central Admin — Threat Analysis Center
- Sophos Firewall — Log viewer (module selector; Add filter; Destroy timing; SSL/TLS timing)
- Sophos Firewall — Log settings (Log firewall traffic; Local reporting; Firewall / SD-WAN log types)
- Sophos Firewall — Logs
- Sophos Firewall — Syslog guide for SFOS 21.5 (
log_type,fw_rule_id, status values,log_idcomposition) - Sophos Firewall — Syslog information (log_id example
010101600001) - Sophos Firewall — Firewall rules (Log traffic; Drop all ID 0; auto-created rules at top)
- Sophos Firewall — Managing SD-WAN routes (Active gateway statuses; SLA isn’t met; SD-WAN Log viewer module)
- Sophos Firewall — IPsec connections (Active vs Connection; partial tunnel)
- Sophos Central Admin — Manage an SD-WAN connection group (VPN tunnel status green / orange / red)
- Sophos Central Admin — Threat Protection Policy (device isolation; red health factors)
Related: Blog 1 · Sophos session factory — SYN_SENT after accept