Microsoft Sentinel is a SIEM factory on a Log Analytics workspace. Official order: install the solution from Content hub, enable the data connector, confirm the table is landing (SigninLogs, AuditLogs, CommonSecurityLog…), then a scheduled analytics rule (or NRT / Fusion / Microsoft security rule) queries that table and raises alerts. Microsoft’s own wording: an incident is a file that aggregates the relevant evidence — alerts plus the entities those alerts mapped. Default behaviour can still create one incident per alert; production turns on alert grouping (up to 150 alerts, then a second incident). Success is a named workspace + last TimeGenerated + an owned incident — not a green tile.
I do not start at isolate. I name the workspace, prove the table with last TimeGenerated, prove the rule is Enabled and has run, then I work the incident — not each alert. Empty hunt is the wrong lake until the picker is proven.
1. Why an empty queue is not a dead SIEM
Every other blog starts at the Incidents blade. That is why students freeze when the queue is empty. The real object is the factory job. An incident is only the last station. If the connector never wrote SigninLogs, or wrote it into law-soc-lab while you hunted in a sibling workspace, the queue is supposed to be empty.
Official: after you onboard Sentinel into a workspace, you use data connectors to start ingesting. Connectors come from Content hub solutions. The connector page names the Log Analytics table. Scheduled rules query that table. Incidents are created from the alerts those rules raise — or imported from other Microsoft / third-party products.
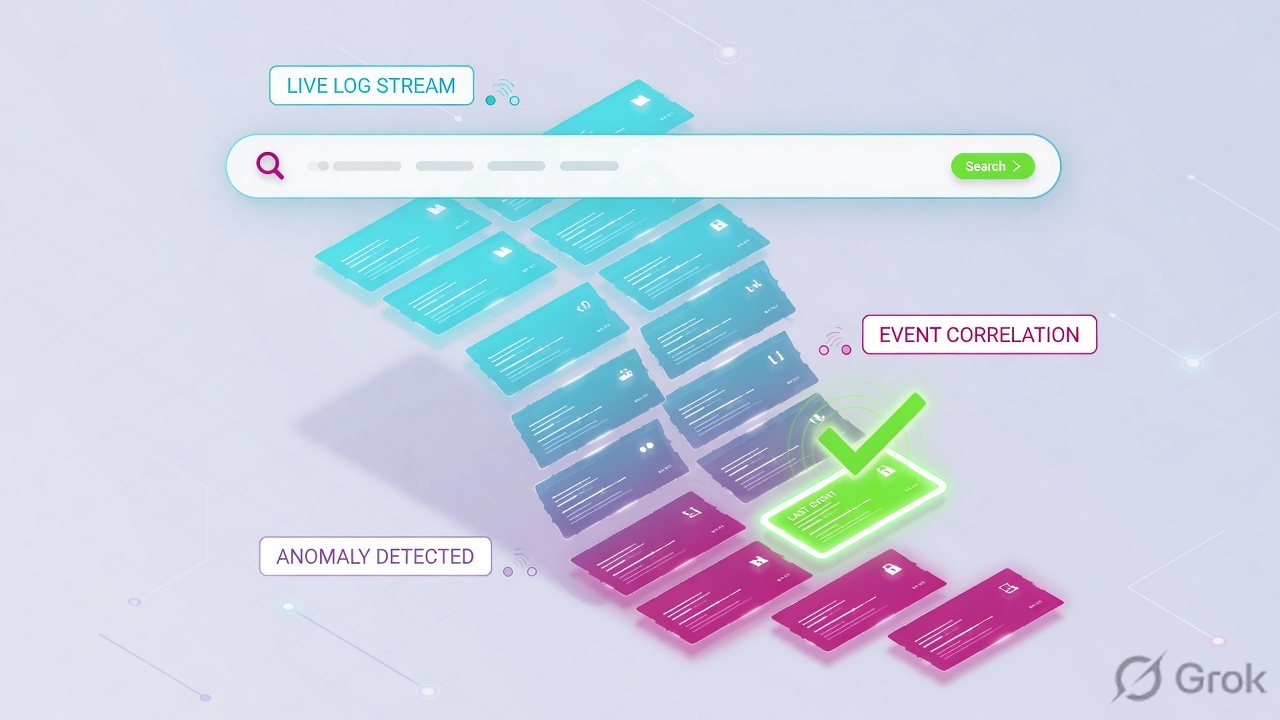
What the ticket asked
“Sentinel is not ingesting.” That sentence is five failures smashed together. The lake, the source, the detector, the case, and the entity are different first clicks.
What you prove first
Workspace name, then last TimeGenerated on the table the ticket actually needs. The evidence desk is the night-shift version of this order.
“No incident means Entra is down — rebuild the AMA / CEF connector.” An empty Incidents grid only means no case was printed. The table may be landing. The rule may be Disabled. You may be in law-soc-lab. Rebuild is change-control, and it is the last station, not the first.
Microsoft Learn documents both the Azure portal and the Defender portal. After 31 March 2027 Sentinel is Defender-only. Field names stay; click-paths move. Azure: Configuration → Data connectors / Analytics / Logs / Incidents. Defender: Microsoft Sentinel → Configuration → Data connectors, Advanced hunting for queries, Investigation & response → Incidents & alerts. Always name the workspace in the picker first.
2. Mental model — four stations, one case
Hold four stations. Interviews fail when people mix them, or skip the first two and start writing KQL.
1. Connector writes the stream
Content hub installs the solution. Data connectors → Open connector page enables the data type. Service-to-service (Entra, Defender XDR) or agent-based (Syslog / CEF via AMA). Proof is Connected + last log received — still not a row you can query.
2. Table is the lake
One Log Analytics workspace is one lake. law-soc-lab and law-soc-prod do not share tables. The connector page names the table: Entra interactive sign-ins land in SigninLogs. CEF lands in CommonSecurityLog. Syslog lands in Syslog.
3. Analytics rule is the detector
Scheduled (most common), NRT (one-minute), Fusion (multistage), or Microsoft security (imported product alerts). The scheduled query must return TimeGenerated — that column is the lookback clock. Threshold + event grouping decide how many alerts print.
4. Incident is the case file
Official: an aggregation of the relevant evidence. It inherits entities, severity, status, and MITRE tactics from its alerts. You assign an owner, read Activity log, run or review playbooks, then close with a classification. Alerts are evidence. The incident is the ticket.
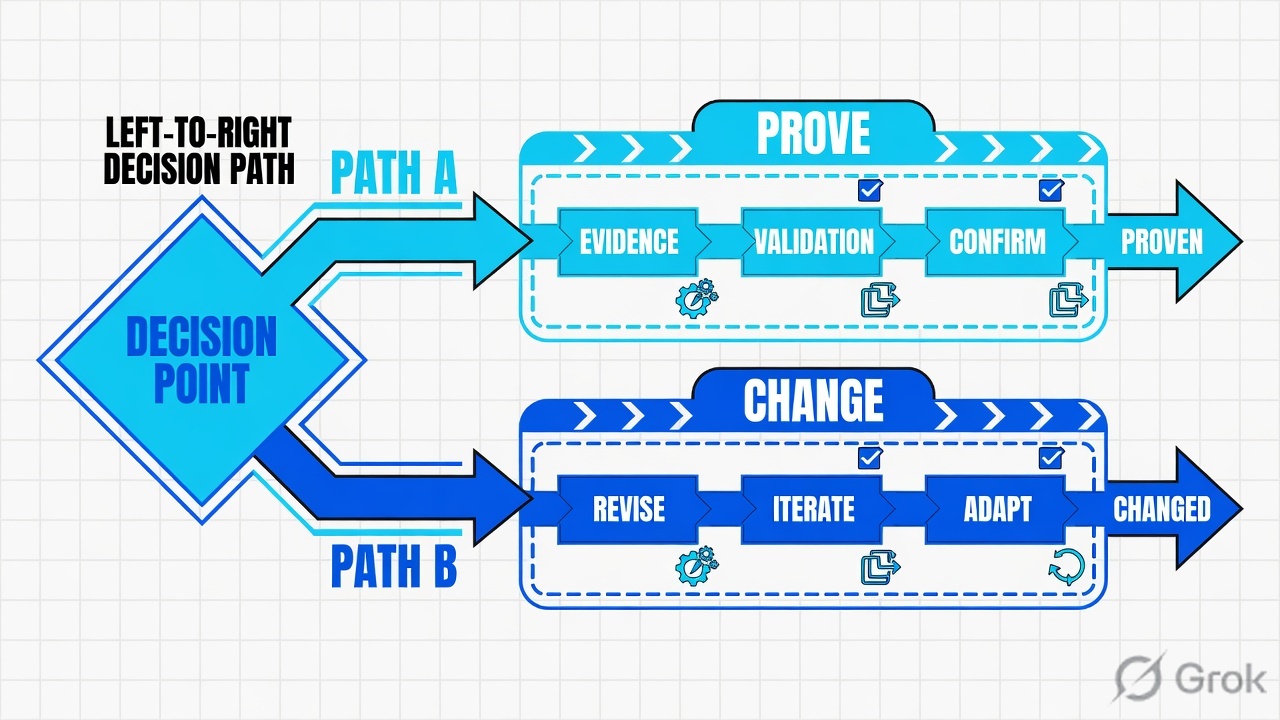
Read left → right. The navy box is the case. Alerts, entities and playbooks are stamps on that one file.
Connector answers “is this source configured to write?” Official: install the solution from Content hub, then Configuration → Data connectors → Open connector page, review Prerequisites, complete Configurations. When connected you see a Data received graph and connectivity status per data type. Connected is not a KQL row.
Table answers “did a row land, and when?” Official: after the connector streams, data appears in the table schemas for the data types you enabled. Query in Logs (Azure) or Advanced hunting (Defender). Scheduled rules use TimeGenerated as the lookback reference — rows outside the lookback window are invisible to the detector.
Analytics rule answers “did a detector fire?” Official scheduled rule: a Kusto query runs on a query interval against a lookback (both 5 minutes to 14 days; interval cannot be longer than lookback). If the result count passes the alert threshold, the rule produces an alert. Entity mapping (up to 10 types) is what later lets grouping and the investigation graph work.
Incident answers “is there a case?” Official: incidents inherit the entities identified in the alerts, plus severity, status, and MITRE tactics. You need Microsoft Sentinel Responder (or higher) to investigate. Guest users who assign incidents also need Entra Directory Reader.
3. Official factory order
The first packet of a new detection has no incident yet. It walks the factory. Later alerts of the same mapped entities can ride an existing case if you turned on alert grouping. That is why “I enabled the rule” sometimes changes nothing until the next interval, and why forty alerts can still be one ticket.
Read left → right, then the green incident bar. Diamond = “did this table receive a row in this workspace?” Not allow/deny.
The connector tile can show Connected because some data type received data in the last days. Your hunt is on SigninLogs. The enabled type might be AuditLogs. Or you are in law-soc-lab. Official next click is the table: SigninLogs | summarize Last=max(TimeGenerated) in the workspace the ticket named. Then the rule’s Enabled + last run. Then the incident.
4. How to choose the station
You are not choosing a product. You are choosing which factory station is allowed to answer the ticket.
| Choice | Use when | Do not use when | Proof you were right |
|---|---|---|---|
| Entra ID connector → SigninLogs | Interactive user sign-ins. Official: Entra ID P1 or P2 required for sign-in logs. | You needed CEF firewall rows. That is CommonSecurityLog, not Entra. |
Connector data type Connected + SigninLogs last TimeGenerated. |
| CEF via AMA → CommonSecurityLog | Appliance that speaks CEF to a Linux AMA forwarder. | Identity IR. Rebuilding FW-LAB-01 will not fill SigninLogs. |
Syslog/CEF docs: CEF messages land in CommonSecurityLog. |
| Scheduled analytics rule | Pattern over a lookback (5 min–14 days). Most Content hub templates. | You need one-minute detection — that is NRT (50 enabled / 100 total). | Active rules tab, type Scheduled, Status Enabled, last run Success. |
| Event grouping = one alert | Default. One run, one summary alert if threshold is met. | You need each row as its own alert (then 150-alert scheduled cap applies). | Alert count on the incident matches how you grouped events. |
| Alert grouping = all entities match | Production. Official recommended setting. Same Account stays one case. | You want every MFA alert as its own ticket. That is default (grouping off). | Incident Evidence shows multiple alerts, one Account entity. |
| Create incidents = Enabled | Standalone Azure-portal lab. Default on a new scheduled rule. | Workspace onboarded to Defender — XDR creates incidents; disable Sentinel-side creation. | Queue shows a case with the expected provider name. |
| Fusion (Advanced Multistage Attack Detection) | Correlate low-fidelity scheduled alerts with tactics + mapped entities. Default enabled. | You treat Fusion as a replacement for a missing Entra connector. | Active rules → filter type Fusion → Enabled. |
Scheduled vs NRT is a clock contract, not a vibe. Official: NRT queries run one minute apart; scheduled interval is 5 minutes to 14 days. Limits: 512 enabled scheduled rules (1024 including disabled); 50 enabled NRT (100 including disabled). Source: Service limits for Microsoft Sentinel.
Isolate is containment on an entity: revoke sessions, disable an inbox rule, isolate a device. Change-control is changing the factory: disable an analytics rule, rebuild a connector, move a workspace. Mid-incident you isolate. You do not “fix Sentinel” by turning the detector off.
5. Runbook Side A → B → C
Lab values only. Workspace law-soc-prod in resource group rg-soc-lab. Training sibling law-soc-lab. User finance.user@lab.example. Device DEVICE-LAB-17. Rule MFA-Fatigue. Incident INC-1042. Playbook Isolate-MDE. Nothing here is a live tenant.
Primary sources named on each side. Field names are from Microsoft Learn, not from a vendor slide.
Side A — workspace, connector, table (building the lake)
Primary source: Connect data sources to Microsoft Sentinel by using data connectors + Send Microsoft Entra ID data to Microsoft Sentinel.
-
Name the workspace before you hunt
Azure portal: directory + subscription selector, then the Microsoft Sentinel workspace. Defender portal: workspace picker / Select a workspace at the top. Lab production lake is
law-soc-prod. EmptySigninLogsinlaw-soc-labis not an Entra outage. Cross-workspace KQL is explicit — the portal works on one workspace at a time. -
Install the solution, then open the connector page
Path: Content hub → install Microsoft Entra ID (optional packaged content) → Configuration → Data connectors → search Microsoft Entra ID → Open connector page. Review Prerequisites. Official roles: Microsoft Sentinel Contributor on the workspace, Security Administrator (or equivalent) on the tenant, plus read/write on Entra diagnostic settings to see connection status.
-
Enable the data type the ticket actually needs
Interactive sign-ins →
SigninLogs(P1/P2). Directory changes →AuditLogs(any Entra license). Do not enable every type “just in case” and then hunt the wrong table. CEF via AMA is a different connector and a different table (CommonSecurityLog). Last-log freshness on the Entra page is not proof for a firewall ticket. -
Prove the table with TimeGenerated
Azure: Logs. Defender: Advanced hunting. Official: scheduled rules use
TimeGeneratedas the lookback reference. A green connector with no recentTimeGeneratedis a silent lake. Data-lake ingestion can take 90–120 minutes after you flip a connector — do not rebuild in the first hour.
SigninLogs
| where TimeGenerated > ago(24h)
| summarize LastSeen=max(TimeGenerated), Rows=count()
// Expected on law-soc-prod: LastSeen within minutes, Rows > 0
// ResultType 50074 = failed MFA challenge (Azure Monitor SigninLogs examples)
Microsoft Sentinel › law-soc-prod › Configuration › Data connectors › Microsoft Entra ID
Microsoft Entra ID · connector page
Lab values only. Sign-in logs require Entra ID P1 or P2. Connected is not a KQL row — prove TimeGenerated next.
Click next: Open in Logs and run last TimeGenerated on SigninLogs in law-soc-prod. Source: Connect data sources · Microsoft Entra ID data connector.
Side B — analytics rule (printing alerts, choosing stamps)
Primary source: Create scheduled analytics rules in Microsoft Sentinel + Scheduled analytics rules in Microsoft Sentinel.
You need Microsoft Sentinel Contributor (write on the workspace and its resource group) to create the rule. Design the KQL in Logs first. The query must return TimeGenerated. Length 1–10,000 characters. Official: cannot contain search * or union *.
Analytics › + Create › Scheduled query rule
Analytics rule wizard · Incident settings
Cap: 150 alerts per incident, then Sentinel opens another incident with the same details. Re-open is unavailable when the workspace is onboarded to Defender.
Source: Create scheduled analytics rules — Incident settings, recommended grouping “all the entities match,” 150-alert cap. Dummy values only.
-
General tab — name, severity, MITRE, status
Configuration → Analytics → + Create → Scheduled query rule. Name must be unique in the workspace. Severity is impact (Informational / Low / Medium / High), not a guarantee. MITRE tactics on the rule apply to every alert and to incidents created from those alerts. Status Enabled runs immediately (or at a Preview start time). Disabled creates the recipe without running it.
-
Set rule logic — query, entities, schedule, threshold
Paste the tested KQL. Map up to 10 entity types (lab: Account ←
UserPrincipalName). Custom details surface extra columns on the alert. Schedule: Run query every 5 minutes, Lookup data from the last 10 minutes (interval ≤ lookback). Threshold: generate alert when number of query results is greater than N (0 = no extra threshold). Event grouping default: Group all events into a single alert. -
Incident settings — create the case, then group
Default: one separate incident per alert. Production: set Group related alerts, triggered by this analytics rule, into incidents to Enabled. Recommended criterion: Group alerts into a single incident if all the entities match. Other options: group all alerts from this rule, or match selected entities + details. Cap: 150 alerts, then a new incident with the same details. If the workspace is onboarded to Defender, leave incident creation Enabled — XDR creates the incidents; grouping is only an initial hint.
-
Automated response, then Review and create
Attach or create an automation rule on this analytics rule. Classic alert-trigger playbooks on that tab are deprecated (Learn: cannot add new ones as of June 2023; migrate to automation rules). Validation must pass before Create. A green create is a recipe. Side C is the proof.
SigninLogs
| where TimeGenerated > ago(10m)
| where ResultType == 50074
| where UserPrincipalName == "finance.user@lab.example"
| summarize Failures=count(), LastSeen=max(TimeGenerated)
    by UserPrincipalName, AppDisplayName
| where Failures >= 10
Say the word predicted. This query is what the rule will run on the next interval. It is not the incident. Compare last run on the rule, then the incident Evidence list, in Side C.
Side C — prove the case in Incidents
Primary source: Investigate Microsoft Sentinel incidents in depth in the Azure portal + Automate threat response with automation rules.
-
Open the case, not the alert list
Azure: Incidents. Defender: Investigation & response → Incidents & alerts → Incidents. Lab case
INC-1042title “Mailbox takeover cluster.” Confirm 3 alerts, shared Accountfinance.user@lab.example, severity High, status New. That is one factory job. Do not open three tickets. -
Read stamps on the incident details page
Left panel always shows owner, status, severity, Evidence (Events / Alerts / Bookmarks), and the first entities. Tabs: Overview (timeline, similar incidents, entities widget, top insights) and Entities. Investigate opens the graph — official: only if the analytics rule or bookmark mapped entities; graph supports incidents up to 30 days old.
-
Activity log before you isolate again
Top bar: Tasks, Activity log, Logs (a full query window inside the incident), Incident actions (Run playbook, Create automation rule, Create team). Quote the last playbook success. If
Isolate-MDEalready succeeded onDEVICE-LAB-17, do not isolate twice. Finish mailbox containment. -
Assign, contain, close with a classification
Set Owner. Move Status New → Active → Closed. Close with True Positive, Benign Positive, False Positive, or Undetermined. Tasks are the checklist. Similar incidents and Top insights are context — they are not a close reason. Running a playbook needs Microsoft Sentinel Playbook Operator plus the Logic App permission; greyed Incident actions is often RBAC, not “Sentinel is down.”
Incidents / INC-1042 · Tasks · Activity log · Logs · Incident actions
Mailbox takeover cluster
Click next: open Activity log, quote the playbook, then assign an owner. Source: Investigate Microsoft Sentinel incidents in depth (Overview, Entities, Activity log, Incident actions).
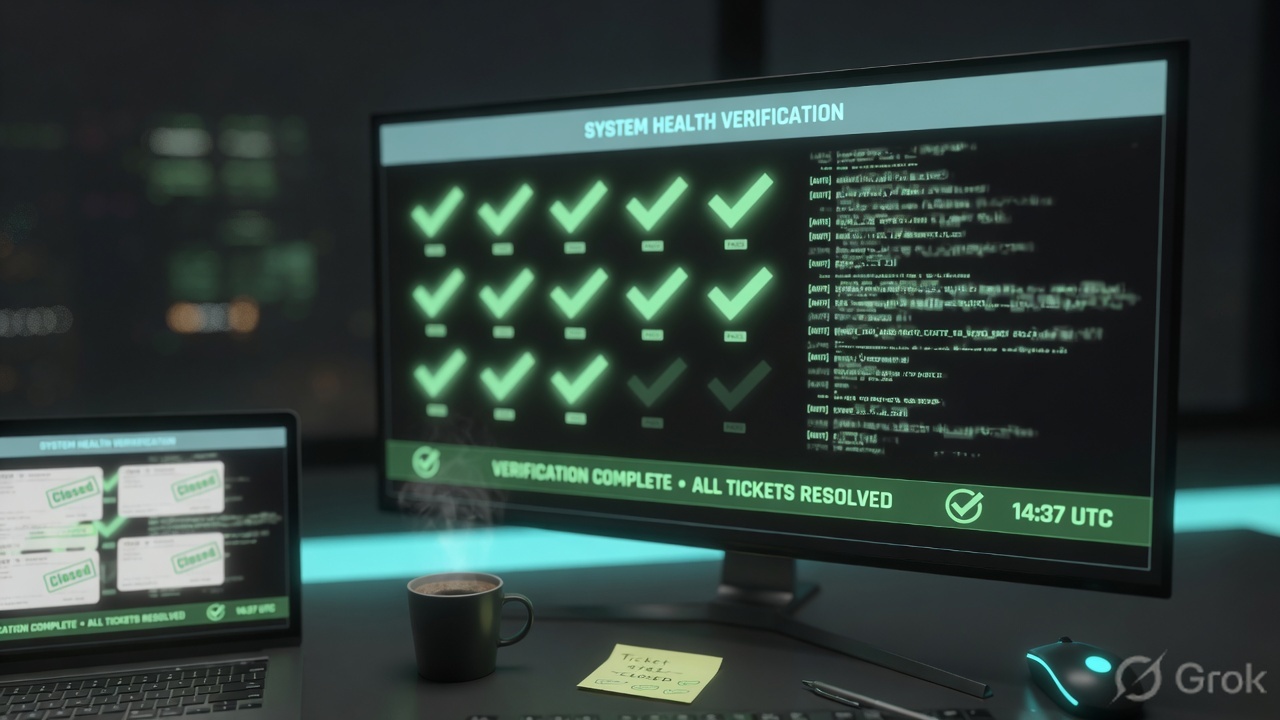
Workspace chrome shows law-soc-prod. SigninLogs last TimeGenerated is fresh. Rule MFA-Fatigue is Enabled and last run succeeded. Incident shows 3 alerts, shared Account, owner named, Activity log quoted. MFA-Fatigue is still Enabled. That is working. A green connector with an empty queue is not.
6. Runtime — grouping, Fusion, Defender, old rules
After go-live the factory still runs in this order. Interview answers that start at “I would write KQL” skip the first two stations. Later alerts of a grouped rule join the open incident until the grouping window or the 150-alert cap says otherwise.
The highlighted station is the case. Playbook success is evidence on the way to an owner — not a reason to skip the mailbox.
Alert grouping vs event grouping. Students invert these. Event grouping decides how query rows become alerts (one summary alert, or one alert per event, scheduled cap 150 / NRT cap 30). Alert grouping decides how those alerts become incidents (off = one incident per alert; on + all entities match = one case). Official: the incident is created after the alerts are generated; all grouped alerts are added immediately.
Defender portal correlation. If the workspace is onboarded, Microsoft Defender XDR creates incidents. Learn: leave Sentinel incident creation Enabled; grouping settings are initial instructions only — XDR may group differently. Re-open closed matching incidents is not available in that mode. Azure-portal queue may show provider Microsoft XDR.
Fusion is the analytics rule named Advanced Multistage Attack Detection, type Fusion, enabled by default. It correlates low-fidelity scheduled alerts that have tactics and mapped entities into a high-fidelity incident. It will not invent an Entra table. Turning Fusion off to “reduce noise” mid-attack is change-control.
Automation order. Official: an incident-created event can trigger several automation rules; they run in configured order; later rules see the incident as the earlier rules left it. Prefer incident-triggered playbooks (the case file) over alert-triggered ones, unless incident creation is disabled and you are automating the raw alert. Playbooks are Azure Logic Apps. Sentinel needs explicit permission on the playbook’s resource group (Manage playbook permissions).
Template updates. Rules created from a template show an Update tag when the author ships a query fix. That is not an outage. Review the diff; do not delete the rule at 02:00. Templates also refuse to create a rule if a required data source is not connected and ingesting — another reason Side A comes first.
Many alerts, one user → open the incident, read the bundle. “Isolate the laptop” → Activity log first; playbook may have run. Hunt returns 0 → name the workspace, then the table, then the rule. Expected alert never fired → table landing + rule Enabled + last run + threshold, not a connector rebuild. Full write-ups live on the evidence desk.
7. Traps + Incidents proof
| Symptom | Looks like | Actually | First move |
|---|---|---|---|
| “Sentinel is not ingesting” | Dead product | Wrong workspace, wrong table, or stale TimeGenerated | Picker + max(TimeGenerated) |
| Connector Connected, hunt empty | Need to rebuild AMA | Different data type, or lab vs prod lake | Open connector page data types, then Logs |
| “40 alerts” | Forty tickets | One incident if grouping / shared entities | Incident alert count + entity list |
| Enabled rule, no incident | Rule is broken | Threshold not met, interval not elapsed, incident creation off, or Defender owns creation | Analytics last run + Incident settings |
| “Isolate the laptop” | Need a second isolate | Playbook already succeeded | Activity log / playbook last run |
| Noisy MFA rule | Disable MFA-Fatigue now | Change-control mid-incident | Contain the account; tune after close |
| Investigation button dead | Portal bug | No entity mapping on the rule | Edit rule → Map entities |
| Incident actions grey | Sentinel is down | Missing Responder / Playbook Operator | RBAC, then retry |
| VIP user | Hide or auto-close | Same physics, louder comms | Watchlist + owner; no raw headers in chat |
- Workspace shown in the portal chrome is
law-soc-prod, notlaw-soc-lab. - Entra connector data type
SigninLogsis Connected; last log received is recent. SigninLogs | summarize max(TimeGenerated)is inside the rule’s lookback window.MFA-Fatigueis Enabled, type Scheduled, last run Success, entity Account mapped.- Incident settings: create incidents Enabled (standalone lab); alert grouping Enabled, all entities match.
- Incident shows 3 alerts, shared Account
finance.user@lab.example, status moved off New, owner named. - Activity log records
Isolate-MDEsuccess — and you did not isolate a second time. - Mailbox containment is written in comments or tasks. Host isolate alone is not enough.
MFA-Fatigueis still Enabled. Tuning is a change-control ticket after close.- Close reason is a real classification, not “cleared to reduce queue.”
Microsoft Sentinel is a SIEM factory on a Log Analytics workspace. A connector writes a table. A scheduled analytics rule queries that table on TimeGenerated and raises alerts. An incident is the case file — an aggregation of those alerts and their entities. I prove the lake first, then the detector, then I work one incident. Empty hunt is the wrong workspace until the picker is proven. Allowing a playbook to isolate a host is not a close.
Knowledge check
Six judgment questions. Map each miss back to the section named in the reason.
Sources
- Microsoft Learn — Microsoft Sentinel data connectors — Content hub solutions, Syslog/CEF via AMA →
Syslog/CommonSecurityLog, service-to-service connectors - Microsoft Learn — Connect data sources by using data connectors — Open connector page, Data received graph, 90–120 min data-lake ingest, query in Logs / Advanced hunting
- Microsoft Learn — Send Microsoft Entra ID data to Microsoft Sentinel —
SigninLogsneeds P1/P2,AuditLogsany license, Contributor + Security Administrator - Microsoft Learn — Create scheduled analytics rules — wizard tabs, TimeGenerated lookback, entity mapping (10 types), event grouping, alert grouping, 150-alert cap, Defender notes
- Microsoft Learn — Scheduled analytics rules in Microsoft Sentinel — interval and lookback 5 min–14 days, severity, templates check data sources
- Microsoft Learn — Investigate Microsoft Sentinel incidents in depth — incident as aggregation of evidence, Responder role, Activity log, Investigate graph + entity mapping, 30-day graph limit
- Microsoft Learn — Automate threat response with automation rules — incident vs alert triggers, assign / tag / task / playbook, order of rules
- Microsoft Learn — Threat detection in Microsoft Sentinel — scheduled, NRT, Microsoft security, Fusion
- Microsoft Learn — Service limits for Microsoft Sentinel — 512/1024 scheduled, 50/100 NRT, 150 / 30 alert caps
- Microsoft Learn — Roles and permissions in the Microsoft Sentinel platform — Reader, Responder, Contributor, Playbook Operator
- Microsoft Learn — Example log table queries for SigninLogs —
ResultType == 50074failed MFA challenge - Microsoft Learn — What is Microsoft Sentinel SIEM? — Azure portal retirement 31 March 2027
Related: Blog 2 · Sentinel evidence desk · Microsoft Sentinel practice hub · Dummy Sentinel lab · Incident investigation deep dive · SOAR automation · UEBA lesson