Logs answers “did this table receive a row, and when was the last TimeGenerated?” Data connectors answers “is this source Connected, and when was the last log received?” Incidents answers “is there a case — status, severity, alert count, owner?” Analytics answers “did the scheduled rule run, and did it reach the threshold?” UEBA / entity answers “how unusual is this account on a 0–10 InvestigationPriority?” A green workspace tile is not a last event. Connected is not a row. A high UEBA score is not malware.
1. Why “is Sentinel ingesting?” is five questions
Operators collapse five failures into one sentence. The query is scoped to the lab workspace. The Entra table is empty. The connector tile is Connected to a sibling data type. The scheduled rule is Enabled but never reached its threshold. The incident exists and is still New. Those are five first clicks.
This page is the night-shift desk for proof. The factory taught table → analytics → alert → incident → playbook → owner. Here you learn the five Microsoft Learn surfaces you actually open, in order, when someone asks you to prove Sentinel is ingesting — or to explain why there is no incident.
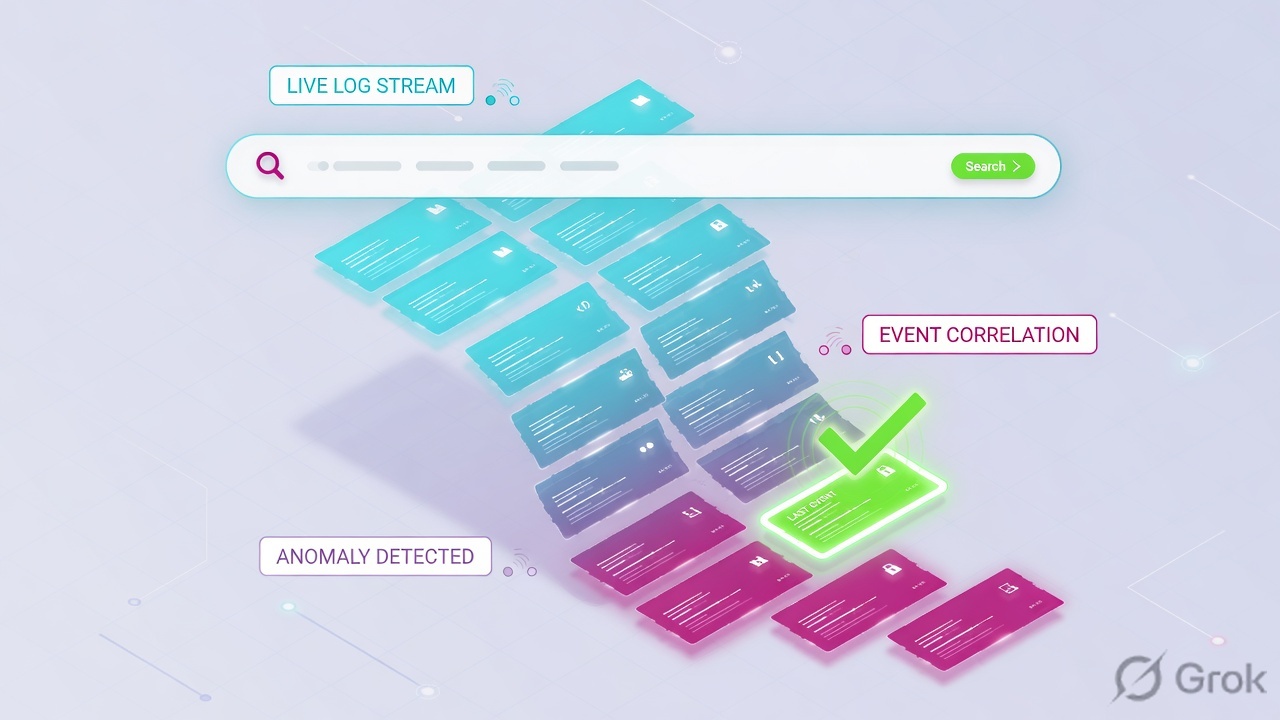
If they say “prove Sentinel is working,” do not say “I opened the portal.” Say: “I prove the lake with Logs last TimeGenerated, the source with Data connectors last log received, the case with Incidents Status / alert count, the detector with Analytics Rule runs, and the entity with UEBA InvestigationPriority.”
Microsoft Learn documents both the Azure portal and the Defender portal. After 31 March 2027 Sentinel is Defender-only. On this desk the field names are the same; the click-path is not. Azure: Configuration → Data connectors / Logs / Incidents / Analytics. Defender: Microsoft Sentinel → Configuration → Data connectors, Advanced hunting for queries, Investigation & response → Incidents & alerts. Always name the workspace in the picker first.
2. Mental model — five proof tools
Memorise five named objects before you click. Each tool is allowed to prove one thing. Over-claiming a field is how you rebuild a healthy AMA or disable detection at 02:00.
1 · Logs (KQL last event)
Azure Logs, or the Logs button on an incident, or Defender Advanced hunting. Proves the table exists in this workspace and when: max(TimeGenerated). Does not prove a connector health event or an incident.
2 · Data connectors
Configuration → Data connectors → Open connector page. Proves Connected, the Data received graph, and connectivity status of the data type you need. Health workbook adds time last log received.
3 · Incidents
Incidents (Azure) or Investigation & response → Incidents (Defender). Proves the case: Status, Severity, Owner, Evidence → Alerts. Empty queue is data — it is not “Sentinel is down.”
4 · Analytics last run
Configuration → Analytics → Active rules. Proves Status (Enabled / Disabled / AUTO DISABLED) and Insights → Rule runs: Execution time + Success. A successful run that missed the threshold creates no alert.
5 · UEBA / entity
Incident Entities tab, or the entity page. Proves InvestigationPriority on BehaviorAnalytics (0 = benign, 10 = highly anomalous). A score supports priority. It does not replace alerts.
Hard words, once
TimeGenerated = the lookback clock scheduled rules use. SentinelHealth = health events for supported connectors and rule runs. InvestigationPriority = 0–10, not 0–100. Workspace = one lake; law-soc-lab and law-soc-prod do not share tables.
Read left → right. Each box is allowed one claim. If you cannot name the field, you are not proving — you are guessing.
I prove the workspace, then the last event, then the connector, then the rule run, then the incident, then the entity score. I do not rebuild AMA, disable a rule, or isolate a host until I can quote the field that made me do it.
3. Decision flow — ticket → first tool
Flowchart first. Do not open Content hub or click Isolate until a diamond says so.
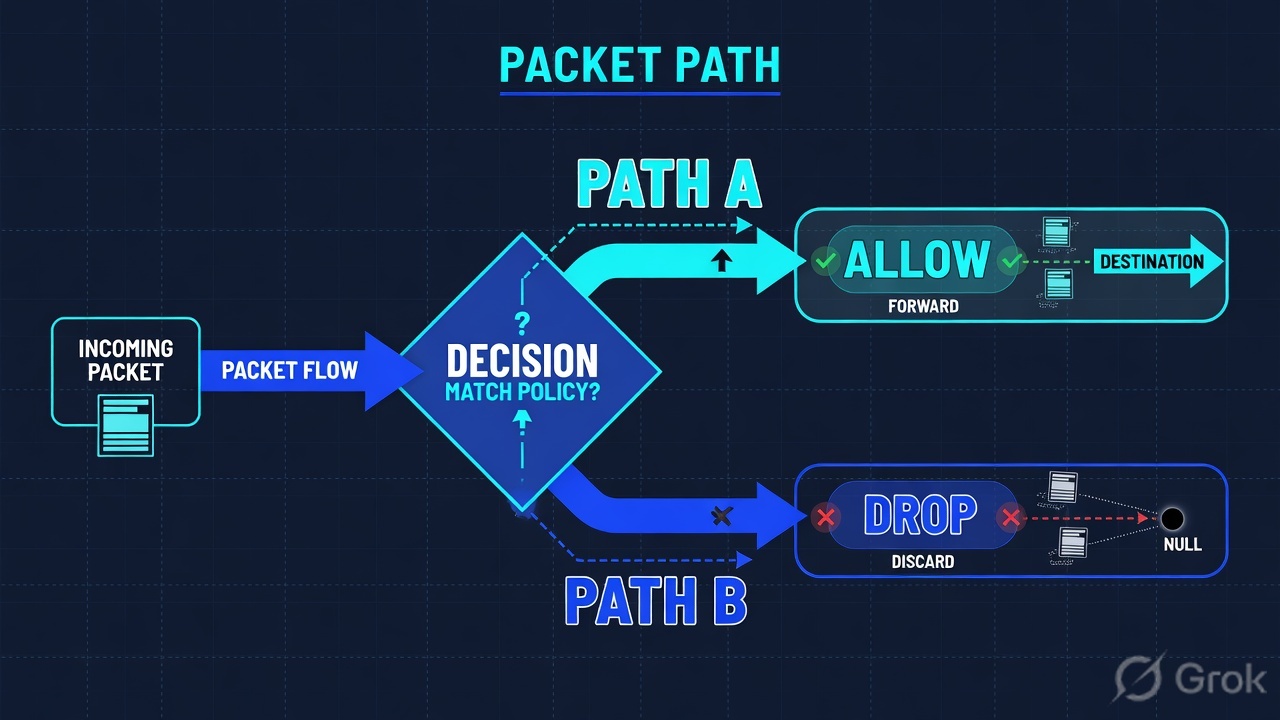
Read the diamond first. “Why no incident?” never starts in Content hub. A dark last event never starts in Analytics. A high UEBA score never starts with isolate-everything.
4. How to choose — first tool + proof field
Print this next to the portal. If you cannot recite the proof field, you are not ready to change anything.
| If the ticket says… | First tool (official path) | Proof field | Do not open first |
|---|---|---|---|
| “Is Sentinel even ingesting?” / hunt is empty | Name the workspace, then Azure Logs or Defender Advanced hunting | max(TimeGenerated) on the table you actually need (lab: SigninLogs) |
Rebuild AMA / recreate the workspace |
| One source “down” after a connector change | Configuration → Data connectors → Open connector page | Connected + Data received + last log received for that data type | A sibling CEF / firewall connector |
| “Why no incident?” after known events | Configuration → Analytics → the rule → Insights / Rule runs | Status Enabled (or AUTO DISABLED) + last run Success + threshold / alert count | Content hub reinstall |
| “40 alerts” / three tickets on one user | Incidents → the case (lab: INC-1042) | Status + Severity + Evidence Alerts count + Owner |
Split the bundle / auto-close |
| “Is this user hot?” / isolate everyone in Finance | Incident Entities tab or entity page | InvestigationPriority (0–10) on BehaviorAnalytics + the mapped Account |
Tenant-wide isolate / disable UEBA |
Microsoft Learn on multiple workspaces: the Defender and Azure portals operate one workspace context at a time unless you write an explicit cross-workspace query. Empty SigninLogs in law-soc-lab is not an Entra outage. Quote the picker name next to the last event.
5. Runbook Side A → B → C
Side A proves the lake: workspace, last event, connector. Side B proves the detector: analytics last run. Side C proves the case: incident + entity. On a messy Sev-2, do them in this order until a field lights up.
Side A — Workspace, Logs, Data connectors (the lake)
-
Name the workspace before you hunt
Azure: directory + subscription selector, then the Microsoft Sentinel workspace. Defender: Select a workspace at the top right. Lab production lake is
law-soc-prod.law-soc-labis the training workspace. Source: Microsoft Learn — Multiple workspaces in the Defender portal; Extend Sentinel across workspaces and tenants. -
Prove the last event, not the blade
Path: Azure Logs, or Logs on the incident page, or Defender Advanced hunting. Official: Get started with log queries in Azure Monitor Logs; scheduled rules use
TimeGeneratedas the lookback reference. Filter the table the ticket named. Quotemax(TimeGenerated)and the row count. Empty is a picker or a table problem — not a reason to rebuild AMA yet. -
If the table is empty in the right workspace, open the connector page
Path: Configuration → Data connectors (Azure) or Microsoft Sentinel → Configuration → Data connectors (Defender). Search the connector, Open connector page. Official: when the connector is connected you see a Data received graph and the connectivity status of the data types. Health workbook Overview adds volume, EPS, and time last log received. Quote the data type you need — Entra
SigninLogsis not CEFCommonSecurityLog. -
Optional health row for supported connectors
If Microsoft Sentinel health monitoring is on, query
SentinelHealthforOperationName == 'Data fetch status change'andStatusSuccess / Failure. Official: currently supported for a listed set (Office 365, Defender for Endpoint, Dynamics 365, AWS, TAXII, CCF, and others). Absence ofSentinelHealthis not “the connector is dead.”
Workspace:       law-soc-prod     (not law-soc-lab)
Path:            Logs  ·  or Advanced hunting
Table:           SigninLogs
Quote:           max(TimeGenerated) + count()
If empty here:   Data connectors → Open connector page → Data received
If empty in lab: switch picker first — do not rebuild AMA
law-soc-prod / Logs / KQL
Logs · last event
| summarize LastEvent = max(TimeGenerated), Rows = count()
LastEvent = 2026-08-16T01:38:12Z Rows = 1842
Source: Microsoft Learn — Get started with log queries in Azure Monitor Logs; Create scheduled analytics rules (TimeGenerated is the lookback reference). Lab workspace only. Training mock · not live.
Configuration / Data connectors / Microsoft Entra ID / Connector details
Microsoft Entra ID
| Data type | Table | Status | Last log received |
|---|---|---|---|
| Sign-in logs | SigninLogs | Connected | 01:38Z |
| Audit logs | AuditLogs | Connected | 01:31Z |
| CEF via AMA (sibling) | CommonSecurityLog | Connected | 01:40Z |
Source: Microsoft Learn — Connect data sources using data connectors (path + Data received + connectivity status); Monitor the health of your data connectors (time last log received). Lab values only.
Side B — Analytics last run (why no incident)
-
Open the rule, not Content hub
Path: Configuration → Analytics → Active rules. Find the scheduled rule the ticket named (lab:
MFA-Fatigue). Official: Status Enabled runs on the query interval; Disabled is created but does not run. Sort by name if you suspect AUTO DISABLED — Microsoft prefixes the name and writes the reason in the description after repeated failures. -
Read Insights, then Rule runs
Select the rule → Insights tab (health monitoring must be on). Official fields: failed executions, top health issues, alert graph, incident classification. Open Rule runs (Preview). Quote Execution time and Status Success (system-triggered). A user-triggered replay is a test — it is not last night’s schedule.
-
A Success can still create zero incidents
SentinelHealthfor a scheduled run can say: “Rule executed successfully, generating n alerts” or “Rule executed successfully, but didn’t reach the threshold (n) required to generate an alert.” Official: Monitor the health and audit the integrity of your analytics rules. If incident creation is Disabled on a standalone Azure-portal workspace, you get alerts without a case. If the workspace is onboarded to Defender, XDR may own incident creation — do not “fix” that mid-shift by flipping the toggle.
Path:            Configuration → Analytics → Active rules → MFA-Fatigue
Status:          Enabled          (or AUTO DISABLED + description)
Insights:        Failed executions · alert graph
Rule runs:       Execution time + Status Success (System-triggered)
If Success + 0:  threshold not reached  ·  or incident creation Disabled
Do not:          disable the rule to “stop the noise”
Side C — Incidents + UEBA / entity (the case)
-
Work the incident, not each alert
Path: Incidents → the case. Official: an incident is an aggregation of the relevant evidence — alerts plus the entities those alerts mapped. Left panel:
Status,Severity,Owner, Evidence → Events / Alerts / Bookmarks. Button bar: Tasks, Activity log, Logs, Incident actions → Run playbook. Quote alert count and owner before anyone isolates. -
Read Activity log before you act again
Official: Activity log shows actions already taken (automation rules, playbooks) and comments. If a playbook already succeeded, do not isolate twice. Finish the mailbox / sessions. Close later with a classification: True Positive, Benign Positive, False Positive, or Undetermined — not “cleared.”
-
Open the entity, quote InvestigationPriority
Entities widget or Entities tab → the Account. Official UEBA:
BehaviorAnalytics.InvestigationPriorityis 0–10 (0 = benign, 10 = highly anomalous).Anomalies.AnomalyScoreis 0–1 and is a different field. The score supports taking the account. It does not prove malware and it does not replace the three alerts. Investigation graph only works if the rule mapped entities.
Incidents / INC-1042 · Overview · Entities · Activity log · Logs
Mailbox takeover cluster
Source: Microsoft Learn — Investigate Microsoft Sentinel incidents in depth (Overview, Entities, Activity log, Incident actions); UEBA scoring (InvestigationPriority 0–10). Lab identities only.
- Side A lake: workspace chrome says
law-soc-prod. Logsmax(TimeGenerated)is inside the ticket window. - Side A source: connector page Connected + last log received on the named data type — or
SentinelHealthStatus Failure with a reason. - Side B: Analytics Status Enabled and Rule runs Success — or AUTO DISABLED / threshold miss quoted as the reason there is no incident.
- Side C: Incident
Status+ alert count + owner written. UEBAInvestigationPriorityquoted as a 0–10 score, not as malware.
6. Five tickets as full stories
These five land every quarter. Memorise first tool + proof field. Times and identities below are lab-only.
| Ticket | Symptom | First tool | Proof field |
|---|---|---|---|
| SEVD-01 | “Is Sentinel even ingesting?” Hunt looks empty | Logs / Advanced hunting | max(TimeGenerated) + workspace name |
| SEVD-02 | Entra “down”; someone wants AMA / CEF rebuilt | Data connectors → Open connector page | Connected + last log received on SigninLogs |
| SEVD-03 | Known MFA burst; “why no incident?” | Analytics → Insights / Rule runs | Status + last Success + threshold / AUTO DISABLED |
| SEVD-04 | “40 alerts — open three tickets” | Incidents → INC-1042 | Status + Severity + Alerts = 3 + Owner |
| SEVD-05 | “This user is hot — isolate Finance” | Entities / entity page | InvestigationPriority 0–10 + the Account |
SEVD-01 — Prove the last event (Logs)
01:42 · P2. Slack: “Is Sentinel even ingesting?” A hunter pasted a zero-row query. The workspace chrome says law-soc-lab. L1 already drafted a connector rebuild.
First tool: name the workspace, then Azure Logs (or Defender Advanced hunting). Run last-event KQL on SigninLogs.
If empty in lab: that sentence is allowed to mean “this picker is the training lake.” Switch to law-soc-prod. Re-run the same query. Quote max(TimeGenerated) and the count. Official: one workspace context at a time.
If empty in prod: now you are allowed to open Data connectors. The Logs page is not a connector health event.
Do not trust a colleague’s last-event query from a different workspace. The proof is the picker name next to TimeGenerated. Do not rebuild AMA from lab emptiness.
SEVD-02 — Prove the source (Data connectors)
02:05 · P2. “Entra is down. Rebuild AMA / CEF.” They point at a green firewall connector because it is the only tile they know.
First tool: Configuration → Data connectors → Microsoft Entra ID → Open connector page.
Proof field: connector Connected, Data received on SigninLogs, last log received inside the ticket window. The CEF-via-AMA sibling can be Connected with last-log 12 seconds ago and still be the wrong object for an identity case. Official: Data received graph + connectivity status of the data types. Health workbook Overview: time last log received.
I would not rebuild AMA. I would quote Connected + last log received on SigninLogs. If that timestamp is stale and Logs last event is stale in prod, then health / SentinelHealth Failure is the next field — still not a firewall rebuild.
SEVD-03 — Prove the detector (Analytics last run)
02:20 · P2. SigninLogs has 28 ResultType 50074 rows for finance.user@lab.example. No incident. Chat says “Sentinel missed it — reinstall the solution.”
First tool: Configuration → Analytics → MFA-Fatigue → Insights / Rule runs.
Proof field: Status = Enabled, last Execution time Success, and either “didn’t reach the threshold” or incident creation Disabled — or the name starts with AUTO DISABLED and the description holds the reason. Official: a successful run that misses the threshold generates no alert. Reinstalling Content hub will not fix a threshold of 100 on a 28-row burst.
Quote Status + last Success + the threshold line. Tuning the threshold is change-control after you contain the account — not a 02:20 disable, and not a solution reinstall.
SEVD-04 — Prove the case (Incidents)
02:40 · P1. “We have 40 alerts. Open three tickets so nothing is missed.”
First tool: Incidents → INC-1042. Official incident details: Overview + Entities; Evidence Alerts / Events / Bookmarks.
Proof field: Severity = High, Status = New, Alerts = 3 (MFA fatigue + impossible travel + new TAP inbox rule), Owner empty. That is one mailbox story. Assign. Do not auto-close. Do not split the bundle. Read Activity log before anyone isolates the laptop again.
Forty alerts is not forty incidents. Default rules can still create one incident per alert; production grouping on matching entities is what made this one case. Work the incident. Factory: an incident is a bundle of alerts.
SEVD-05 — Prove the entity (UEBA)
03:00 · P2. Manager: “Investigation priority is high — isolate every Finance host.” Someone read a number and heard malware.
First tool: INC-1042 → Entities → Account finance.user@lab.example (or the entity page / Entity behavior).
Proof field: InvestigationPriority = 8 (range 0–10) on BehaviorAnalytics. Official: the score quantifies deviation from baseline. It supports taking over the account. It is not a host-isolate order and it is not a tenant Sev-1. You still need the three alerts and mailbox containment.
I would paste “InvestigationPriority 8/10 on finance.user — score, not malware.” I would not isolate the Finance VLAN. I would finish sessions + the TAP inbox rule on that one Account.
7. Traps + close-the-ticket proof
| You see | Weak close | Strong close |
|---|---|---|
| Empty KQL in law-soc-lab | “Sentinel is down” / rebuild AMA | Quote the picker; re-run last TimeGenerated in law-soc-prod |
| Last event fresh, still “not ingesting” | “Logs are fine, ignore the ticket” | You only proved the table. Open Incidents / Analytics if the ask is “why no incident?” |
| Connector tile Connected | “Ingestion is healthy” | Connected is not the data type. Quote last log received on SigninLogs |
| CEF last-log 12s | Rebuild AMA during identity IR | Wrong object. Leave the firewall path alone |
| Analytics Status Enabled | “The rule is working” | Read Rule runs Success + threshold / alert count |
| AUTO DISABLED on the rule name | Reinstall Content hub | Quote the description reason; fix query / permissions; change-control to re-enable |
| High incident, still New | Auto-close / three tickets | Assign owner; quote Alerts = 3; read Activity log |
| InvestigationPriority 8 | Isolate Finance / declare malware | 0–10 score on the Account; finish mailbox containment |
| Playbook already succeeded | Isolate the laptop again | Activity log last success; do not isolate twice |
- Workspace name written next to the tool you opened.
- Lake proved with Logs
max(TimeGenerated)when the ticket is “is it ingesting?” - One source quoted: Data connectors Connected + last log received on the named data type — or Analytics Rule runs Success + threshold — or Incidents
Status+ alert count — or UEBAInvestigationPriority0–10. - Next tool named — or change-control owner named. No connector rebuild without a stale last-log in the right workspace.
MFA-Fatiguestill Enabled unless AUTO DISABLED is the official state you are escalating.- Close classification is a real value, not “cleared.”
I name the question, then the first tool, then one official field. Logs last TimeGenerated proves the lake. Data connectors last log received proves the source. Incidents Status / alert count proves the case. Analytics Rule runs proves the detector. UEBA InvestigationPriority proves how unusual the entity is. I do not rebuild AMA, disable a rule, or isolate a host until that field is on the ticket. Factory model: an incident is a bundle of alerts.
Knowledge check
Six night-shift judgments. Each maps to a first tool or a proof field. Check answers, then Reset if you picked the wrong surface.
Sources
- Microsoft Learn — Get started with log queries in Azure Monitor Logs (Logs / KQL)
- Microsoft Learn — Create scheduled analytics rules (
TimeGeneratedlookback; Status Enabled / Disabled; incident settings; threshold) - Microsoft Learn — Connect data sources using data connectors (Configuration → Data connectors; Open connector page; Data received; connectivity status)
- Microsoft Learn — Microsoft Sentinel data connectors
- Microsoft Learn — Monitor the health of your data connectors (time last log received;
SentinelHealthData fetch status change) - Microsoft Learn — SentinelHealth table columns schema
- Microsoft Learn — Investigate Microsoft Sentinel incidents in depth (Status, Severity, Owner, Evidence, Activity log, Logs, Incident actions, Entities)
- Microsoft Learn — Scheduled analytics rules (alert grouping, 150-alert cap)
- Microsoft Learn — Monitor and optimize analytics rule execution (Insights; Rule runs Execution time / Success)
- Microsoft Learn — Troubleshoot analytics rules (AUTO DISABLED)
- Microsoft Learn — Monitor analytics rule integrity (Success generating n alerts / didn’t reach the threshold)
- Microsoft Learn — UEBA in Microsoft Sentinel (
InvestigationPriority0–10;AnomalyScore0–1) - Microsoft Learn — UEBA reference (
BehaviorAnalytics.InvestigationPriority) - Microsoft Learn — Microsoft Sentinel entity pages
- Microsoft Learn — Multiple workspaces in the Defender portal
- Microsoft Learn — Extend Microsoft Sentinel across workspaces and tenants
- Microsoft Learn — Automate threat response with automation rules
Related: Blog 1 · An incident is a bundle of alerts · Microsoft Sentinel practice hub · Dummy Sentinel lab · Incident investigation · UEBA lesson · SOAR automation