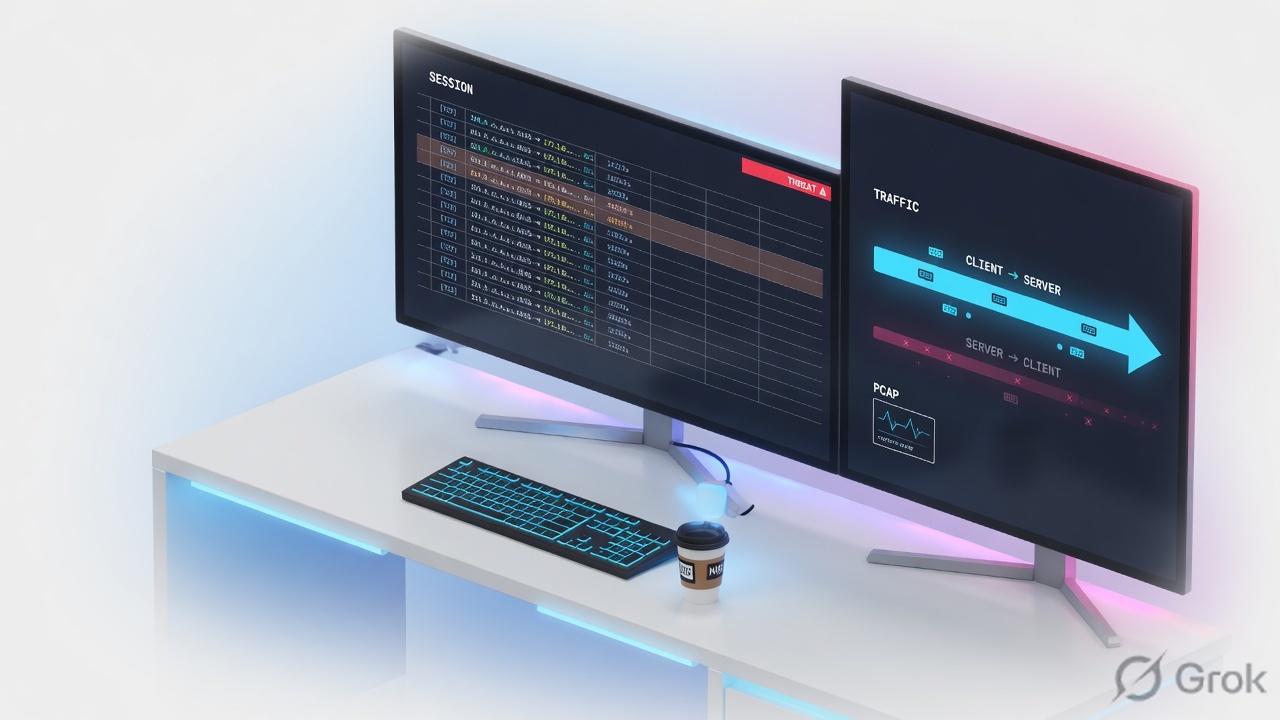
If it is happening now, open Monitor → Session Browser and then show session id. If it already ended, open Monitor → Logs → Traffic and read Action, Bytes Received, and Session End Reason. If Session End Reason is threat, the next screen is Monitor → Logs → Threat, not a wider allow. Packet capture is last, scoped, and you turn it off.
Traffic is history. Session Browser is live. Threat is why an allow still died. show session id is the two halves of the ticket. Pcap stages tell me whether the packet entered, matched a session, left the box, or was dropped on it.
1. Why the desk exists
The factory lesson taught you that PAN-OS manufactures a two-way session. This page is 02:00, when someone wants a wider rule and you have sixty seconds to pick a window. The five tools below are all on the Monitor tab plus one CLI twin. None of them is Policies → Security.
A log is an automatically generated, time-stamped file. Official docs put every log type under Monitor → Logs. Session Browser is not a log — it is the current running table. Packet Capture is not a log either. Mixing those three is how juniors brief the wrong cause.
Traffic log — start/end/drop/deny history of a session. Threat log — a Security profile (or zone protection) fired. Session Browser — sessions that still exist on the dataplane. Session ID — the internal number that joins Traffic, Threat, and show session id. Session End Reason — why the session died; if several reasons apply, PAN-OS keeps the highest priority. Pcap stage — receive, firewall, transmit, or drop.
2. Mental model — five tools
Each tool answers one question. Use the wrong one and you will quote a field that cannot prove the ticket.
Traffic log
History. Path: Monitor → Logs → Traffic. Proves Rule Name, Action, Bytes Sent / Bytes Received, Application, Session End Reason, Session ID.
Threat log
Profile verdict. Path: Monitor → Logs → Threat. Proves Threat/Content Type, Threat ID, Severity, Action (alert / drop / reset-both…), Session ID. Click the paper-clip when a threat pcap exists.
Session Browser
Live table. Path: Monitor → Session Browser. Proves the session still exists, the live Rule, Application, and the two byte counters before the Traffic end line is written.
show session id
CLI twin of the Browser detail. Proves c2s vs s2c, NAT addresses, src-user, rule, action, start-time. Same Session ID you copied from Traffic or the Browser.
The fifth tool is Monitor → Packet Capture. It is change-adjacent (CPU, hardware offload) and it is how you prove where the packet died after the logs have spoken. Isolate first. Capture second. Filter always.
| Tool | When it exists | It cannot prove |
|---|---|---|
| Traffic | After a start or end (or drop/deny) is logged. Default on most allow rules is log-at-session-end, so the useful line often appears after the user hangs up. | A session that is still open and only logs at end. Why a profile reset it (that is Threat). |
| Threat | When traffic matches a Security profile (or some zone-protection events). Type = THREAT. | A missing allow. An implicit deny. A silent return-path failure with no signature. |
Session Browser / show session id |
While the dataplane still holds the slot. | Yesterday’s outage. A deny that never created a long-lived session. Application success just because Action is allow. |
| Packet Capture | After you set filters, turn Filtering ON, add stages, turn Packet Capture ON, and reproduce. | Anything if you left filters off and captured the whole box. Anything if you forgot the NAT return filter. |
3. First-tool decision
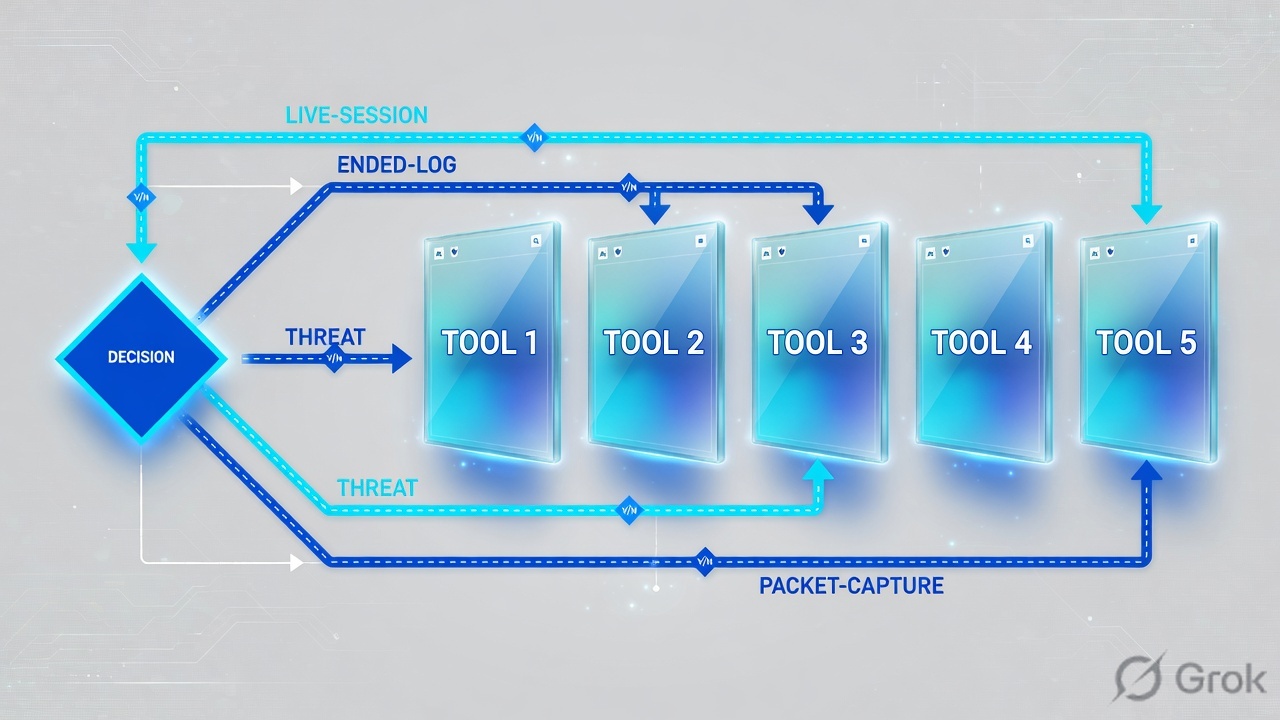
Do not improvise. Ask two questions out loud: is it still happening, and did the user hear a reset? The flowchart is the whole first minute.
Read left → right, then down. Diamond = decision. Pink is Threat. Amber is “allow with zero return.” Blue bar is last, not first.
4. Five tickets · first tool + proof field
Memorise this table. It is the interview and the bridge. Dummy 5-tuple on this page: client 192.0.2.25 (example\finance.user) → 198.51.100.44:443, session 48219, rule finance-saas, DIPP 203.0.113.10.
| # | Ticket you hear | First tool | Proof field you quote |
|---|---|---|---|
| 1 | Browser spins right now. “Firewall is blocking Salesforce.” | Monitor → Session Browser, then show session id 48219 |
total byte count(s2c) / Bytes Received = 0 while Action = allow and Rule = finance-saas |
| 2 | It already failed. Nothing useful in Session Browser. | Monitor → Logs → Traffic | Session End Reason = policy-deny plus Rule Name and Action (deny or drop) |
| 3 | “The firewall reset me.” Page died mid-flow. | Monitor → Logs → Threat (Traffic End Reason will already say threat) |
Threat Action (reset-both / drop / reset-client…) + Threat ID + same Session ID |
| 4 | Application column is not-applicable. User never got a page. |
Monitor → Logs → Traffic | Threat/Content Type subtype = drop and Application = not-applicable — dropped before App-ID |
| 5 | “Prove where the packet died.” Logs already spoken. | Monitor → Packet Capture | Which stage file exists: receive / firewall / transmit / drop |
Source for the log columns: Traffic Log Fields and Threat Log Fields. Source for the Browser: Monitor → Session Browser. Source for stages: Building Blocks for a Custom Packet Capture.
Action is what the rule or profile did (allow, deny, drop, reset both…). Session End Reason is why the slot closed. Priority order starts at threat, then policy-deny, then decrypt reasons, then TCP RST / FIN / reuse, then aged-out. A start log has Session End Reason n/a — that is not a mystery, that is “this line is not an end.”
5. Runbook · Side A logs, Side B session, Side C pcap
Work the same 5-tuple through all three sides. Do not skip to C because a capture feels more senior. Primary source for Side A clicks: View and Manage Logs. Filter syntax: Basics of Traffic Monitor Filtering.
Side A — Traffic then Threat
-
Open Traffic and write a filter, do not scroll
Monitor → Logs → Traffic. Click Add Filter or type. Start wide, then add. Documented host/port form:
Traffic filter — documented syntax(addr.src in 192.0.2.25) and (addr.dst in 198.51.100.44) and (port.dst eq 443)
Useful extras:
(action eq deny),(rule eq 'finance-saas'),(zone.src eq trust),(sessionid eq 48219), time with(receive_time geq '2026/08/15 02:00:00'). Click the spyglass for Detailed Log View — NAT Source IP, bytes both ways, Session ID. -
Read four columns before you speak
Type / subtype (
start,end,drop,deny) · Action · Bytes Received · Session End Reason. Official meaning of drop vs deny: drop often means the session died before App-ID and there was no allowing rule; deny means App-ID ran and a blocking rule (or no allow) applied. Applicationnot-applicableis the drop-before-App-ID tell. -
If Session End Reason is threat, change tab
Monitor → Logs → Threat. Filter the same Session ID or the same 5-tuple. Quote Threat/Content Type (
vulnerability,spyware,virus…), Threat ID, Severity, and Action.alertdid not kill the session.reset-both,drop,reset-client,reset-serverdid. Traffic Action can still say allow — the profile acted after the rule.
Monitor › Logs › Traffic
Traffic
| Type | From / To | Src / Dst | App | Rule | Action | Bytes S / R | End Reason | Session |
|---|---|---|---|---|---|---|---|---|
| end | trust → untrust | 192.0.2.25 → 198.51.100.44:443 | ssl | finance-saas | allow | 2844 / 0 | aged-out | 48219 |
| deny | trust → untrust | 192.0.2.40 → 203.0.113.80:22 | ssh | interzone-default | deny | 64 / 0 | policy-deny | 48188 |
Highlight row 48219. Action allow + Bytes Received 0 + aged-out is Ticket 1 after the session dies. Click the spyglass for NAT Source IP (203.0.113.10) and Session ID. Training mock · RFC 5737 only.
Source: View and Manage Logs — Select Monitor → Logs, then the log type. Filter artifacts with AND. Detailed Log View is the spyglass. Training mock · not live.
Side B — Session Browser and show session id
-
Filter the live table
Monitor → Session Browser. Official help: browse and filter current running sessions. Filter Source Address, Destination Address, Destination Port, From / To zone, Application, Rule — the same 6-tuple the dataplane keys on. If the table is empty, you may be on the passive HA peer, or the session already aged out into Traffic.
-
Copy Session ID, then open CLI
show session id 48219is the same object. Read c2s and s2c as two flows. Quotetotal byte count(c2s)andtotal byte count(s2c),rule,action,application, and the s2c destination (post-NAT). Zero s2c with action allow is Ticket 1. Do not add a rule.
Monitor › Session Browser
Session Browser
| Session ID | From / To | Src / Dst | App | Rule | Action | c2s / s2c |
|---|---|---|---|---|---|---|
| 48219 | trust → untrust | 192.0.2.25 → 198.51.100.44:443 | ssl | finance-saas | allow | 2844 / 0 |
| 48102 | trust → untrust | 192.0.2.18 → 203.0.113.50:443 | ssl | corp-web | allow | 88210 / 41022 |
Session 48219 is live. Traffic may not have an end line yet if the rule only logs at session end. Click 48219 → same fields as show session id 48219.
Source: Monitor → Session Browser — current running sessions. GUI twin of show session. Training mock · RFC 5737 only.
admin@PA-VM> show session id 48219
Session          48219

        c2s flow:
                source:      192.0.2.25 [trust]
                dst:         198.51.100.44
                proto:       6
                sport:       53122          dport:      443
                state:       ACTIVE         type:       FLOW
                src-user:    example\finance.user

        s2c flow:
                source:      198.51.100.44 [untrust]
                dst:         203.0.113.10
                sport:       443            dport:      18422

        start-time                  : 08/15 02:11:08
        timeout                     : 3600 sec
        total byte count(c2s)       : 2844
        total byte count(s2c)       : 0
        application                 : ssl
        rule                        : finance-saas
        action                      : allow
        session end reason          : aged-out
What you say. “The factory printed an allow on finance-saas and sent 2844 bytes. The server sent nothing back to the DIPP address 203.0.113.10. I will not add a rule. Next proof is NAT, return route, ARP, and the SYN-ACK.”
Side C — pcap stages (last, scoped)
Primary source: Take a Custom Packet Capture. Official warning: the feature is CPU-intensive. Turn it off.
-
Identify the 5-tuple from Traffic first
Use the spyglass. If NAT is in play you need two filters: pre-NAT source → destination, and destination → NAT Source IP. Official Telnet example uses exactly that pair.
-
Monitor → Packet Capture
Clear All Settings. Manage Filters → Add. Set Source, Destination, Dest Port, Proto. Set Filtering = ON (OFF captures everything). Add four stages with unique file names. Set Packet Capture ON. Reproduce once. Set Packet Capture OFF. Refresh the Captured Files list. Download.
-
Read which file exists
No drop file means the dataplane did not take the drop-stage path for that filter. Receive without transmit is “entered, did not leave.” That is the sentence you owe TAC.
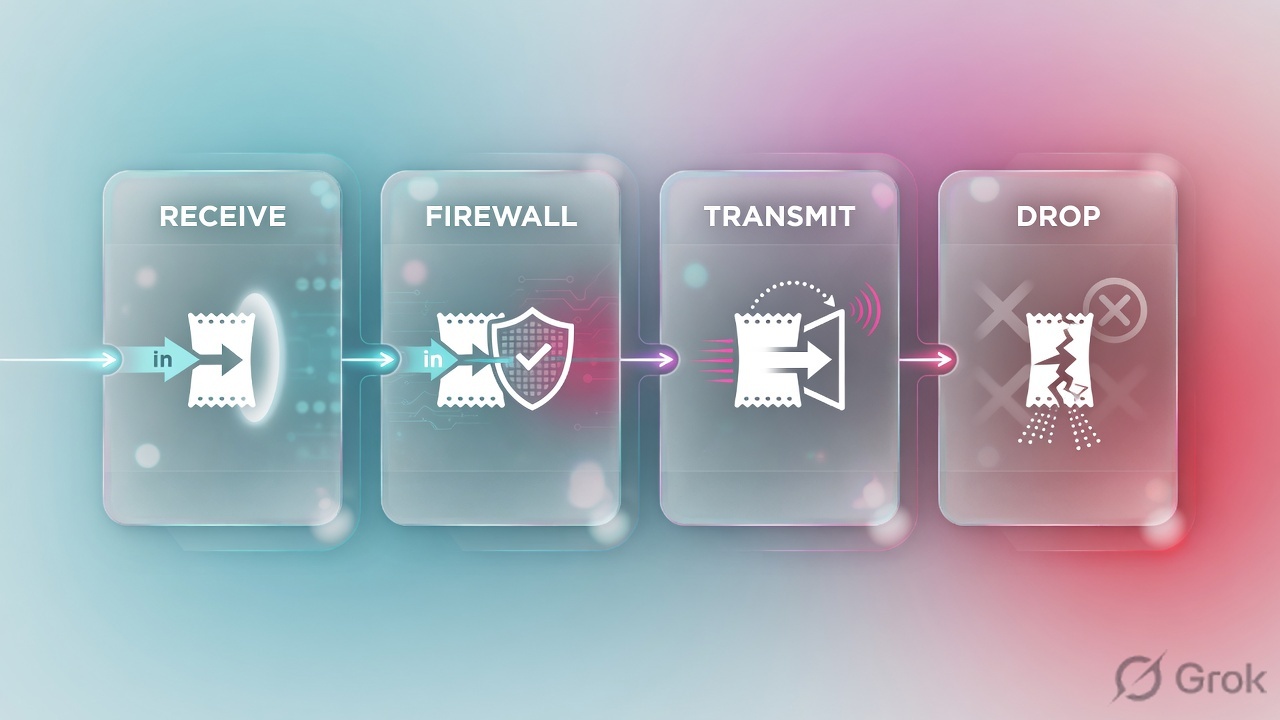
Stage names are from the Monitor → Packet Capture help: receive, firewall, transmit, drop. Do not rename them “ingress / egress” in the ticket.
Monitor › Packet Capture
Packet Capture
Official fields: Id, Ingress Interface, Source, Destination, Src Port, Dest Port, Proto, Non-IP, IPv6. Stages: drop, firewall, receive, transmit. Unique File name per stage.
Source: Take a Custom Packet Capture + Building Blocks for a Custom Packet Capture. Two filters when NAT is in play. Training mock · not live.
Packet Capture ON, Pre-Parse Match, Disable Hardware Offload, clear session, debug packet-diag, and commit all need an owner and a backout. Leaving capture on is how a Sev-1 becomes a Sev-1 plus a slow dataplane. Threat pcaps configured on a Security profile are a different switch — Clear All Settings does not turn those off.
6. After the click — what you re-read
Once the user retries, you do not open a new theory. You re-read the same Session ID.
- Still live? Session Browser c2s / s2c should both move. If only c2s grows, Ticket 1 is still open.
- Ended clean? Traffic Type =
end, Action =allow, Session End Reason =tcp-fin, Bytes Received > 0. - Ended dirty? End Reason
threat→ Threat tab.policy-deny→ Rule Name.tcp-rst-from-server→ the server, not a missing allow.decrypt-cert-validation/decrypt-unsupport-param/decrypt-error→ decryption policy, not Security. - No Traffic line at all? Confirm log-at-session-end on the hit rule, confirm you are on the active unit, confirm the filter is not tighter than the 5-tuple.
7. Traps and proof checklist
| You saw | Junior close | Actual close | Proof field |
|---|---|---|---|
| Action allow, Bytes Received 0, aged-out | Add a wider rule | Return path / NAT / server | Bytes Received · s2c · NAT Source IP |
| Session End Reason = threat | The allow is wrong | A profile acted | Threat Action + Threat ID + Session ID |
| Application = not-applicable, subtype drop | App-ID is broken | Dropped before App-ID (service deny or implicit deny) | subtype + Application + Rule Name |
| Empty Session Browser | Firewall is dropping everything | Already ended, or you are on the passive | Traffic end line · HA role |
| No Traffic line while it is happening | Logging is broken | Rule logs at session end only | Session Browser Session ID now |
| tcp-rst-from-server | Firewall reset the user | The server sent RST | Session End Reason (not Threat unless also threat) |
| Receive pcap full, transmit empty, drop present | WAN is down | Died on this dataplane | Stage file names |
| Capture with Filtering OFF | “We have a pcap” | You captured the box | Filter Id 1 + Filtering ON |
- You named first tool and one proof field from the five-ticket table.
- You filtered Traffic with
(addr.src in …)/(addr.dst in …), not a free-text guess. - You quoted Session ID and used the same number on Threat /
show session id. - If s2c / Bytes Received was 0 and Action was allow, you did not add a rule.
- If Session End Reason was
threat, you opened Threat and quoted Action + Threat ID. - If you captured, Filtering was ON, NAT had two filters, all four stages were named, and Packet Capture is OFF.
I prove PAN-OS with five tools. Live sessions go to Session Browser and show session id. History goes to Traffic — I quote Action, Bytes Received, and Session End Reason. Threat is a different log. Packet capture is staged receive, firewall, transmit, drop, and I turn it off. I do not add an allow to fix zero return bytes.
Knowledge check
Six judgment calls. Reasons point back to the first-tool table or the pcap stages.
Sources
- View and Manage Logs — Monitor → Logs, spyglass Detailed Log View, filter artifacts, export
- Log Types and Severity Levels — Traffic start/end/drop/deny, Application not-applicable, Threat profile entries
- Traffic Log Fields — Action, Session ID, Bytes Sent/Received, Session End Reason priority list (threat → policy-deny → decrypt-* → tcp-rst/fin → aged-out → n/a)
- Threat Log Fields — Type THREAT, subtypes, Action (alert, drop, reset-both…), Session ID, PCAP flag
- Monitor → Session Browser — current running sessions
- Firewall Session Overview —
show session id, c2s / s2c - Basics of Traffic Monitor Filtering —
(addr.src in …),(addr.dst in …),(port.dst eq …),(action eq allow|deny) - Take a Custom Packet Capture — filters, NAT needs two filters, stages, turn capture off
- Building Blocks for a Custom Packet Capture — stage definitions: receive, firewall, transmit, drop
- Take Packet Captures — hardware offload note; feature is CPU-intensive
Related: PAN-OS is a session factory · Security policy — first match, then prove it · Traffic not passing — 7-step ladder · NAT deep dive · Logging and reporting · Palo Alto interview hub · Palo Alto course