Client Status answers “is this device steering?” Application Events answers “did this SaaS activity Allow, Block, Alert, or Bypass — and which policy?” Page Events answers “did this browser page even land in Skope IT?” Alerts answers “which policy / DLP / malware object fired?” Transaction Events answers “what did this one HTTP transaction do?” An Allow is not a healthy page. A green Client icon is not an Application Event row.
1. Why “is it working?” is five questions
Operators collapse five failures into one sentence. The laptop never steered. The page never aggregated. Policy blocked the upload. A DLP profile fired and nobody quoted its name. The HTTP transaction used an SSL bypass the Page Event never showed. Those are five first clicks.
This page is the night-shift desk for proof. The factory taught the exchange — steer first, then name the decision. Here you learn the five tools you actually open, in order, when someone asks you to prove Netskope is working.
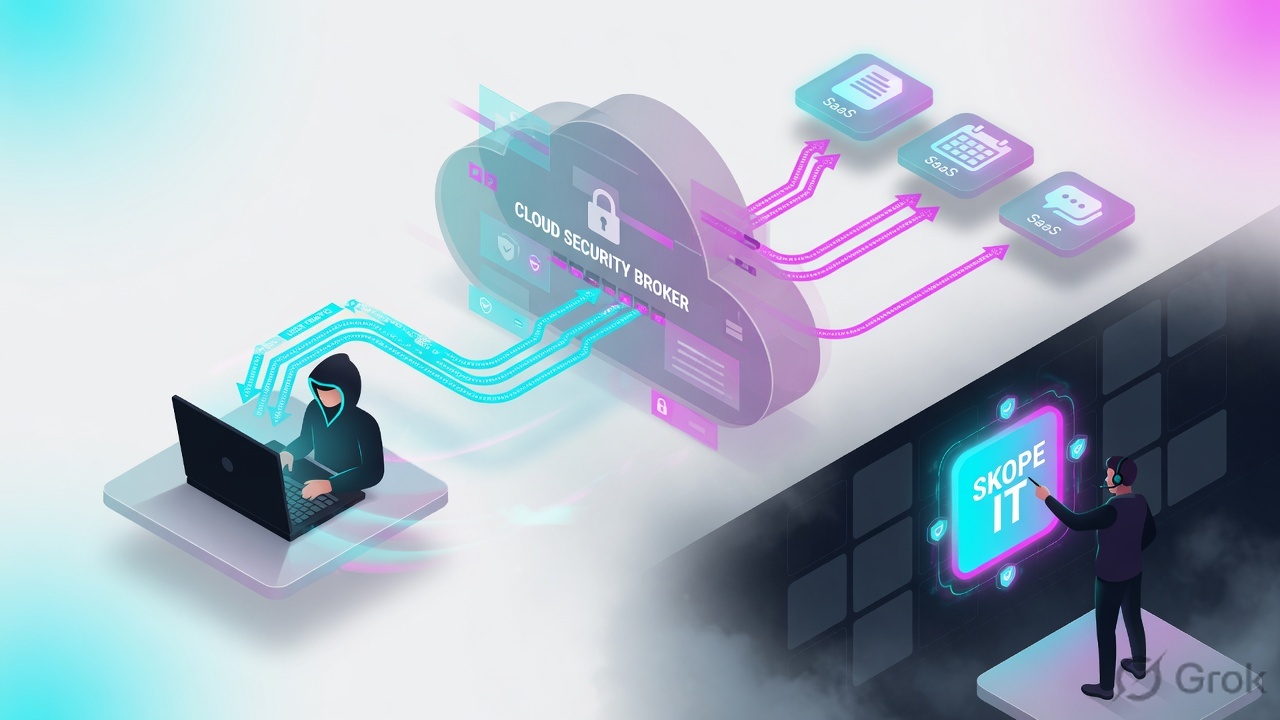
If they say “prove Netskope is working,” do not say “I opened the tenant.” Say: “I prove the wire with Devices Internet Security Status + Last Event, the SaaS activity with Application Events Action + Policy Name, the page with Page Events Site / Bypass Traffic, the incident with Alerts Name + Type + Action, and the exact HTTP hop with Transaction Events Action (Real-time Protection Policy).”
2. Mental model — five proof tools
Memorise five named objects before you click. Each tool is allowed to prove one thing. Over-claiming a field is how you ship a bad change at 02:00.
1 · Client Status / steering
Settings → Security Cloud Platform → Netskope Client → Devices. Proves whether this device is Enabled, Disabled, Errored, Fail Closed, or Backed Off. Does not prove a URL verdict.
2 · Application Events
Skope IT Events & Alerts → Application Events. Proves one SaaS activity: Action + Policy Name (+ DLP Profile Name). Does not prove a browse page.
3 · Page Events
Skope IT Events & Alerts → Page Events. Proves a web page was seen: Site, Total Bytes, Bypass Traffic. Official FAQ: action stays empty unless Isolation.
4 · Alerts
Skope IT Events & Alerts → Alerts. Proves a policy / DLP / malware / anomaly hit: Name + Type + Action. Alerts fire only when a policy or watchlist matches.
5 · Transaction Events
Skope IT Transaction Events (Advanced Analytics holds the same family). Proves one HTTP row: Action (Real-time Protection Policy) + Name, plus SSL Bypass / Status Code / POP.
Hard words, once
Steering Configuration = what enters the tunnel. Backed Off = Client auto-disabled (GRE / IPSec / Secure Forwarder). nspolicy = Application Event type. TxN = Transaction Event — batched, up to five minutes late.
Read left → right. Each box is allowed one claim. If you cannot name the field, you are not proving — you are guessing.
I prove the Client, then the SaaS activity, then the page, then the alert, then the HTTP transaction. I do not change Real-time Protection, SSL Decryption, or a Steering Configuration until I can quote the field that made me do it.
3. Decision flow — ticket → first tool
Flowchart first. Do not open the policy editor until a diamond says so.
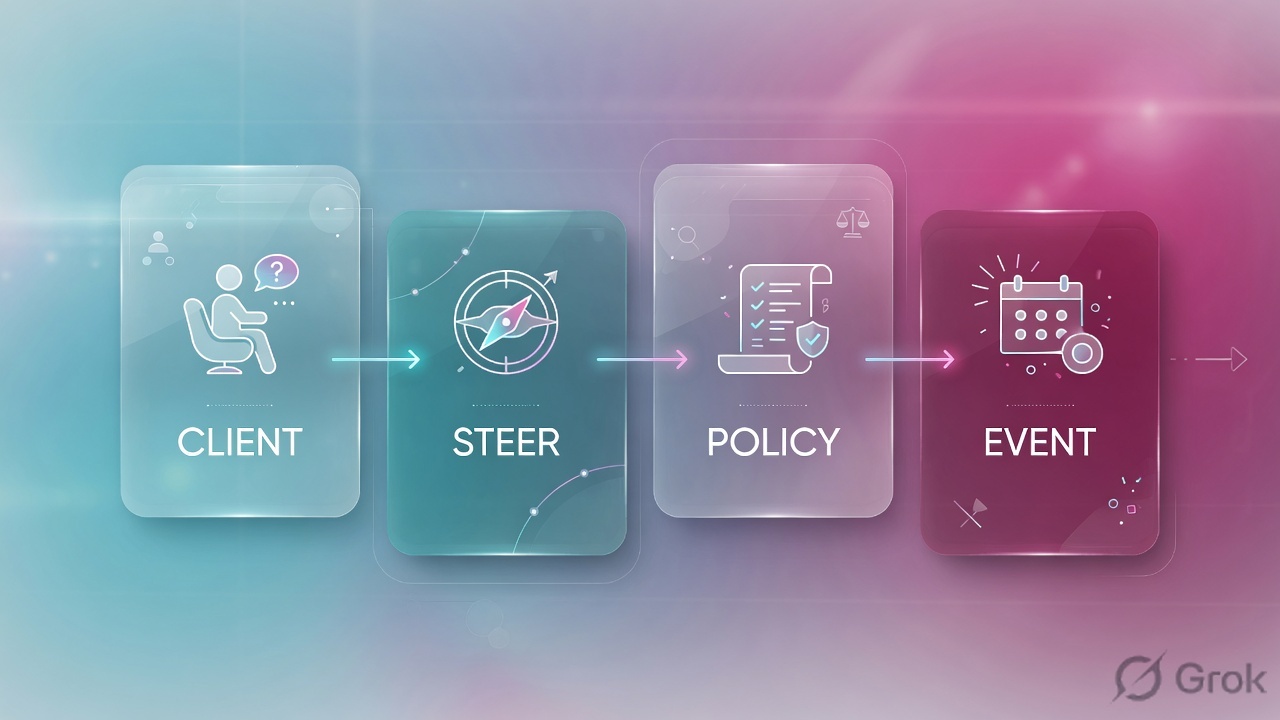
Read the diamond first. A DLP upload never starts in Page Events. Allowed + SSL error never starts in a new Allow. “Disabled / Backed Off” never starts in Policy Name.
4. How to choose — first tool + proof field
Print this next to the tenant. If you cannot recite the proof field, you are not ready to change anything.
| If the ticket says… | First tool (official path) | Proof field | Do not open first |
|---|---|---|---|
| Laptop / hotel / “am I even in Netskope?” | Settings → Security Cloud Platform → Netskope Client → Devices | Internet Security Status (Enabled / Disabled / Errored / Fail Closed / Backed Off) + Last Event + Steering Configuration on View Details |
A new Real-time Protection Allow |
| One SaaS activity blocked after a policy / DLP change (Upload, Download, Share) | Skope IT Events & Alerts → Application Events | Action (Block / Bypass / Alert / Isolate) + Policy Name (+ DLP Profile Name, DLP Rule Name, Incident ID) |
Page Events bytes, Alerts without the activity row |
| A website “does not load” / empty Application Events / “is it even going through?” | Skope IT Events & Alerts → Page Events | Site + Total Bytes; or Bypass Traffic = yes + Bypass Reason (Steering Exception) |
A Cloud App rule edit |
| SOC / DLP / malware / “we have a hit” | Skope IT Events & Alerts → Alerts | Name (policy that triggered) + Type (policy, DLP, malware, anomaly) + Action (alert, block, detection) |
Devices Enable / Disable as the first click |
| Page or app “looks Allowed” but the API / SSL / status code is wrong | Skope IT Transaction Events (Advanced Analytics for the same family + longer retention) | Action (Real-time Protection Policy) + Name (Real-time Protection Policy); add SSL Bypass / Action (SSL Policy) / Status Code / POP |
A tenant-wide inspect-off |
They are two independent Skope IT modules. Application Events are user actions inside an app — Login, Logout, Upload, Download, Share. Page Events are a heuristic roll-up of a web page (content-type text/html, >3K, referrer fan-out, 60-second wait). A 1 GB Download Application Event may not appear in that page’s Bytes Downloaded. Do not reconcile them to the byte.
5. Runbook Side A → B → C
Side A proves the Client is steering and names the SaaS activity. Side B proves the page and the alert object. Side C proves the one HTTP transaction when the summaries disagree. On a messy Sev-2, do them in this order until a field lights up.
Side A — Client Status, then Application Events
-
Prove the device is steering
Path: Settings → Security Cloud Platform → Netskope Client → Devices. Search the username. Read
Client Status,Internet Security Status,Private Apps Access Status,Last Event,Last Event Actor,Last Event Time. Official Client Status table: Enabled means at least one service is on; Disabled means all services are off. Source: Devices. -
Open View Details before you invent a bypass
Hostname → View Details. Quote
Steering ConfigurationandClient Configuration. Event History names Tunnel Up, Tunnel Down, User Disabled, Admin Disabled, Tunnel down due to GRE / IPSec (status Backed Off), Detected Dead Peer, Ping timeout. A tray icon photo is not this page. -
If the Client is Enabled, open Application Events — not the policy editor
Path: Skope IT → Events & Alerts → Application Events. Filter Username + Application + date range. Query Mode example from Help:
app eq 'Google Drive' and user eq 'priya@lab.example'. Add Activity = Upload if the ticket is a file. -
Read the two columns that close a policy ticket
Customize Columns → Alert group:
Action,Policy Name,DLP Profile Name,DLP Rule Name,Incident ID, Type. Default table already shows Time, Username, Application, Activity, Object, Site. Source: Application Events.
Settings / Security Cloud Platform / Netskope Client / Devices
Devices
| Hostname | User | Client Status | Internet Security | Last Event | Last Event Time |
|---|---|---|---|---|---|
| LAPTOP-BOM-14 | priya@lab.example | Enabled | Enabled | Tunnel Up | 01:38 UTC |
| LAPTOP-HOTEL-7 | priya@lab.example | Disabled | Backed Off | Tunnel down due to GRE | 01:41 UTC |
Last Event Actor: System · Service: Internet Security
Backed Off = Client auto-disabled (GRE / IPSec / Secure Forwarder / Express Connect) — not a Policy Name.
Source: Netskope Docs — Devices (Settings → Security Cloud Platform → Netskope Client → Devices). Internet Security Status values: Enabled, Disabled, Errored, Fail Closed, Backed Off. Lab identities only. Training mock · not live.
Skope IT / Events & Alerts / Application Events
Application Events
| Time | Username | Application | Activity | Object | Action | Policy Name |
|---|---|---|---|---|---|---|
| 01:36 | priya@lab.example | OneDrive for Business | Login | — | Allow | — |
| 01:39 | priya@lab.example | OneDrive for Business | Upload | q3-payroll.xlsx | Block | RTP-DLP-Finance-Upload |
Source: Netskope Docs — Application Events (Skope IT → Events & Alerts → Application Events). Alert columns: Type, Policy Name, DLP Profile Name, DLP Rule Name, Action, Incident ID. Query Mode example is from that page. Lab identities only.
Side B — Page Events, then Alerts
-
Open Page Events when the complaint is a website, not an activity
Path: Skope IT → Events & Alerts → Page Events (Help also writes Skope IT → Events → Page Events). Default columns: Time, Username, Application, Site, Total Bytes. Customize for Bytes Uploaded / Downloaded, Access Method, URL, Category.
-
Treat empty or Bypass Traffic as steering evidence
Official FAQ: when traffic is steered and then bypassed (steering exception or SSL Do Not Decrypt), the proxy can emit a Page Event with
Bypass Traffic= yes, suppressed at one event per domain per minute, without total bytes. First access of a Steering Configuration category exception showsBypass Reason : Steering Exception. Second access is Client-side — no Page Event. -
Do not hunt Action on a normal Page Event
Official FAQ: “no action is logged unless it is Isolation (a page-based action). For all other Page Events, the action field will remain empty.” Isolate is also a valid Action filter on Application Events and Alerts when RBI is deployed. Path to filter: Page Events → Action → Isolate → Apply.
-
If SOC said “we have a hit,” switch to Alerts
Path: Skope IT → Events & Alerts → Alerts. Default: Time, Name (the policy that triggered), Type (policy, DLP, malware, anomaly), Action (alert, block, detection), Activity, Username, Application, Site, Object, Account Name. Rule columns add Policy Name, DLP Profile Name, DLP Rule Name. Alerts generate only when a policy or watchlist matches — a regular event otherwise.
Page path:     Skope IT → Events & Alerts → Page Events
Quote:         Site + Total Bytes + Bypass Traffic + Bypass Reason
Empty page:    first-access Steering Exception, or Client never steered
Action:        empty unless Isolation (RBI)

Alerts path:   Skope IT → Events & Alerts → Alerts
Quote:         Name + Type + Action + Object
Query sample:  alert_type eq DLP and user eq 'priya@lab.example'
Caveat:        RTP “Alert” on Browse activity does not generate an Alert event
Side C — Transaction Events / Advanced Analytics
-
Open Transaction Events when summaries disagree
Path: Homepage → Skope IT → Transaction Events. Official: a comprehensive log of HTTP transactions; Page / App events are rolled up to avoid noisy web traffic. TxN is the row. Not available in FedRAMP, PBMM, and RUH1 tenants. Batched — may appear up to five minutes late. Do not declare “empty” at T+30 seconds.
-
Filter the RTP action, not the vibe
Filters include
Action (Real-time Protection Policy),Name (Real-time Protection Policy),Action,Action Reason,SSL Bypass,SSL Bypass Reason,Action (SSL Policy),Name (SSL Policy),Status Code,Remote Status Code,POP,SNI,URL,Access Method(Client),Transaction ID. Source: Skope IT Transaction Events. -
Open the plus icon — Client / Netskope / Remote Server
Details are grouped as Client (who initiated), Netskope (what the cloud enforced), Remote Server (destination). Copy the RTP Action + Name. If SSL is the ticket, copy SSL Bypass / SSL Policy Action, not a new web Allow.
-
Use Advanced Analytics when you need the same family at longer retention
Advanced Analytics Transaction Events is the analytics surface for the same HTTP events — granular bytes, SSL-error visibility, IOC search on longer packages. Pause / resume ingestion lives under Advanced Analytics → Data Retention. It is not a second policy engine.
Homepage / Skope IT / Transaction Events
Transaction Events
| User | SNI | Access Method | Action (RTP) | Name (RTP) | SSL Bypass | Status |
|---|---|---|---|---|---|---|
| priya@lab.example | login.salesforce.com | Client | allow | RTP-SaaS-Allow | no | 200 |
| priya@lab.example | api.salesforce.com | Client | allow | RTP-SaaS-Allow | yes | 403 |
POP: BOM1 · Transaction ID: txn-lab-88421
Allow + SSL Bypass + 403 is not a missing Cloud App rule. Quote SSL Policy Name next.
Source: Netskope Docs — Skope IT Transaction Events (Homepage → Skope IT → Transaction Events). Filters include Action / Name (Real-time Protection Policy), SSL Bypass, Status Code, POP. Batched, up to five minutes. Lab identities only.
- Side A Client:
Internet Security Status= Enabled andLast Event= Tunnel Up at the ticket minute. Side A activity: Application Event namesAction+Policy Name. - Side B page: Page Event for that
Sitewith bytes — or an explicitBypass Traffic= yes. Side B alert: AlertsName+Type+Actionon the same Object. - Side C: Transaction Event
Action (Real-time Protection Policy)+Namematches the change you just made (wait the batch window).
6. Five tickets as full stories
These five land every quarter. Memorise first tool + proof field. Times and identities below are lab-only.
| Ticket | Symptom | First tool | Proof field |
|---|---|---|---|
| NEVD-01 | WFH laptop: “internet is broken, Netskope is down” | Devices | Internet Security Status + Last Event (Tunnel Up / Down / User Disabled / Backed Off) |
| NEVD-02 | After a new DLP rule, OneDrive opens, payroll.xlsx upload fails | Application Events | Action = Block · Policy Name = the RTP / DLP rule |
| NEVD-03 | Salesforce “will not load”; Application Events empty | Page Events | Site + Bypass Traffic / empty page = steering miss |
| NEVD-04 | SOC: “we have a DLP hit on q3-payroll.xlsx” | Alerts | Name + Type = DLP + Action + Object |
| NEVD-05 | Page looks Allowed; API 403 / cert pin / SSL error | Transaction Events | Action (RTP Policy) + SSL Bypass / Status Code |
NEVD-01 — Prove the Client (Devices)
01:42 · P2. Priya on a hotel network that also has a guest GRE to NewEdge. Client tray looks green-ish on a phone photo. L1 already drafted a Real-time Protection Allow.
First tool: Settings → Security Cloud Platform → Netskope Client → Devices, search priya@lab.example.
If Backed Off / Disabled: Last Event = Tunnel down due to GRE (or IPSec, Secure Forwarder). Official status is Backed Off — the Client auto-disabled because another steering method is on the path. Quote that event. Next check is whether she should be Client-steered or site-steered — not Application Events policy.
If Enabled + Tunnel Up: you are allowed to open Skope IT for her user and the failing app. Client Status = Enabled is not Action = Allow.
Do not trust a colleague’s Devices row from a different hostname. The proof is the failing Unique Device ID. Admin Disabled and User Disabled are different Last Event Actor values — do not “re-push the MSI” for an Admin Disabled on purpose.
NEVD-02 — Prove the SaaS activity (Application Events)
02:05 · P2. OneDrive in the browser opens. q3-payroll.xlsx upload fails after last night’s DLP ship. Someone wants “another Allow for onedrive.live.com.”
First tool: Skope IT → Events & Alerts → Application Events. Query app eq 'Microsoft Office 365 OneDrive for Business' and user eq 'priya@lab.example', last hour, Activity = Upload.
Proof field: Login row can be Allow; Upload row Action = Block and Policy Name = RTP-DLP-Finance-Upload, with DLP Profile Name and Incident ID on the Alert columns. That name is the ticket. Change that one rule — or the exception process — Apply Changes, then re-read the same two columns.
I would not add a second web Allow. I would quote Policy Name on the Upload Application Event. Apply Changes is not proof until the same filter returns Allow (or the agreed exception).
NEVD-03 — Prove the page (Page Events)
02:20 · P2. Salesforce “the site is down.” Application Events for Salesforce is empty. L1 wants Force-disable SSL for the OU.
First tool: Skope IT → Events & Alerts → Page Events. Filter Username + Site + last 30 minutes.
Proof field: either a Page Event for salesforce.com with Total Bytes, or Bypass Traffic = yes and Bypass Reason : Steering Exception, or nothing. Nothing after an Enabled Client still usually means the first-access exception already moved to Client-side bypass — or the flow never hit NewEdge. Official: Page Events are not a bandwidth tool; some URLs miss the heuristic.
Empty Application Events plus a Bypass Page Event is a steering ticket, not a Cloud App rule. Quote Bypass Reason. Do not Apply Changes on Real-time Protection from an empty activity log.
NEVD-04 — Prove the object (Alerts)
02:40 · P2. SOC Slack: “DLP hit on payroll.” Finance wants DLP disabled for the night.
First tool: Skope IT → Events & Alerts → Alerts. Query alert_type eq DLP and the user. Read Name, Type, Action, Object.
Proof field: Type = DLP, Action = block, Object = q3-payroll.xlsx, Name = the policy. That is a control success until an exception owner says otherwise. A DLP block is not an outage — the factory already taught that sentence; this desk makes you paste the alert.
Do not start by Disable on Devices. And do not wait for an Alert on a Real-time Protection policy whose action is Alert on Browse — official Alerts page: those Browse/Alert combinations do not generate Alert events.
NEVD-05 — Prove the HTTP row (Transaction Events)
03:00 · P3. Salesforce UI loads. The Lightning API returns 403. Page Event exists. Application Event for Login is Allow. Someone typed Sev-1 in the channel.
First tool: Skope IT → Transaction Events. Filter User + SNI api.salesforce.com. Wait the batch window if the table is empty.
Proof field: Action (Real-time Protection Policy) = allow, SSL Bypass = yes, Status Code = 403, POP named. The page Allow did not inspect the API. That is an SSL Policy / pin / Do Not Decrypt conversation — not a new Cloud App Allow and not a tenant outage.
I would leave the RTP Allow alone. I would paste the TxN row: RTP Action + SSL Bypass + Status Code + POP. Advanced Analytics is the same family if you need longer retention or SSL-error hunting — not a third policy place.
7. Traps + close-the-ticket proof
| You see | Weak close | Strong close |
|---|---|---|
| Internet Security Status = Disabled / Backed Off | “Netskope is down” / new RTP Allow | Quote Last Event (User Disabled, Admin Disabled, GRE/IPSec Backed Off); fix steering; wait for Tunnel Up |
| Client Enabled, still failing | “Netskope is fine” | You only proved the wire. Open Application Events or Page Events. |
| Application Event Action = Allow | “Netskope is working” | Allow is a verdict on that activity, not the page and not the HTTP status. |
| Empty Application Events | A Cloud App rule blocked everything | Devices first, then Page Events Bypass Traffic |
| Page Event with bytes | “The upload succeeded” | Page Events are not Application Events. Official FAQ: bytes may not include the 1 GB Download. |
| Page Event action empty | Policy must be broken | Official: action is empty unless Isolation. |
| No Alert for a Browse / Alert RTP | Logging is down | Official Alerts caveat. Look at Page / Application Events instead. |
| TxN empty at T+30s | Declare not steered | Official batch delay up to five minutes. Re-query. FedRAMP / PBMM / RUH1 have no Skope IT TxN page. |
| Allow + SSL Bypass + 403 | New web Allow / tenant Sev-1 | Quote SSL Policy Name / SSL Bypass Reason + Status Code |
- UTC window written next to the tool you opened.
- Wire proved on the failing device (Devices
Internet Security Status+Last Event) when the ticket is “am I in Netskope?” - One transaction quoted: Application Events
Action+Policy Name, or Page EventsSite/Bypass Traffic, or AlertsName+Type+Action, or one TxN RTP Action + Name. - Next tool named — or change-control owner named. No Apply Changes without residual control.
- Peer or second host compared when you claim “not a tenant outage.”
- Page Event bytes not used as DLP proof. TxN emptiness not declared before the five-minute batch.
I name the question, then the first tool, then one official field. Devices proves the Client. Application Events proves the SaaS activity. Page Events proves the browse. Alerts proves the object that fired. Transaction Events proves the HTTP row. I do not change Real-time Protection, SSL Decryption, or a Steering Configuration until that field is on the ticket. Factory model: steer first, then name the decision.
Knowledge check
Six night-shift judgments. Each maps to a first tool or a proof field. Check answers, then Reset if you picked the wrong surface.
Sources
- Netskope Docs — Devices (Settings → Security Cloud Platform → Netskope Client → Devices;
Client Status,Internet Security Status,Last Event, Backed Off, Steering Configuration on View Details) - Netskope Docs — Steering Configuration (Settings → Security Cloud Platform → Steering Configuration)
- Netskope Docs — Creating a Steering Configuration (Client auto-disables when it detects IPSec, GRE, or Explicit Proxy)
- Netskope Docs — Using Netskope Client (tray Configuration status / last config update)
- Netskope Docs — Application Events (Skope IT → Events & Alerts → Application Events; Alert columns: Policy Name, Action, DLP Profile Name)
- Netskope Docs — About Page Events (Skope IT → Events → Page Events; Time, Username, Application, Site, Total Bytes)
- Netskope Docs — Page Events FAQs (heuristic; Bypass Traffic; action empty unless Isolation; independent of Application Events)
- Netskope Docs — Alerts (Skope IT → Events & Alerts → Alerts; Name, Type, Action; Browse/Alert caveat)
- Netskope Docs — Skope IT Queries Library (
action,alert_type,access_method,app) - Netskope Docs — Isolation Events in Skope IT (action = isolate on Page Events, Application Events, Alerts)
- Netskope Docs — Skope IT Transaction Events (Homepage → Skope IT → Transaction Events; Action / Name of RTP Policy; 5-minute batch; FedRAMP / PBMM / RUH1)
- Netskope Docs — Advanced Analytics Transaction Events (granular HTTP family; SSL-error visibility)
- Netskope Docs — Transaction Events Fields Reference (RTP Action: allow, block, bypass, alert, useralert; policy name)
Related: Blog 1 · Netskope session factory · Architecture & steering · DLP deep-dive · Private Access (NPA) · Netskope practice dashboard