show security flow session answers “did this 5-tuple become a session — which policy, which In/Out counters?” show log / structured syslog answers “what did the box write when the session was created, closed, or denied?” security flow traceoptions (or monitor security flow) answers “why did the first packet never become a session?” show chassis cluster status and show security ipsec security-associations answer “am I on the data primary, and is the VPN SA even installed?” J-Web Monitor → Security → Flow Session is the same session table in a browser. A Valid session is not a working application. A green J-Web dashboard is not Out Pkts.
1. Why “is it working?” is five questions
Operators collapse five failures into one sentence. The first packet never matched a from-zone/to-zone policy. The session formed and Out Pkts stayed 0. The node you logged into is not the redundancy-group primary. Phase 2 never installed. The first-path drop is only in a scoped flow trace. Those are five first tools.
This page is the night-shift desk for proof. The factory taught zone → policy → NAT → session. Here you learn the five tools you actually open, in order, when someone asks you to prove the SRX is working.
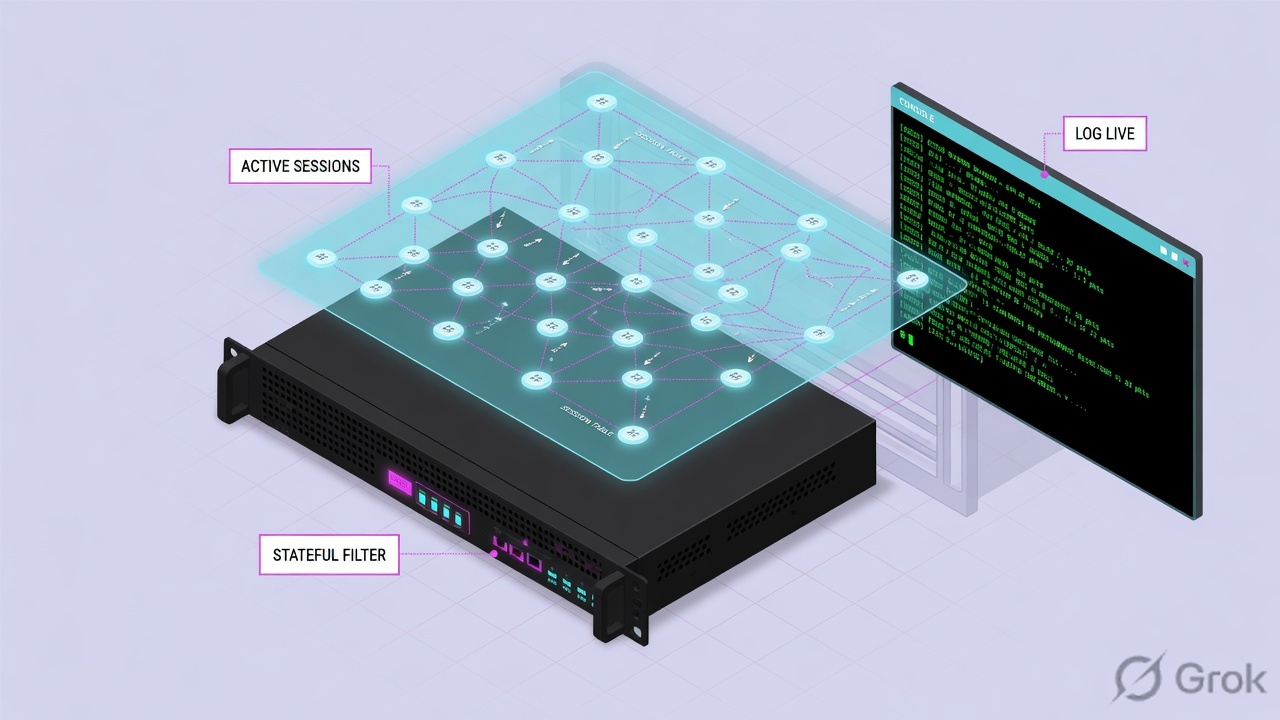
If they say “prove the SRX is working,” do not say “I opened J-Web.” Say: “I prove the live session with show security flow session Session ID / Policy name / In / Out, the history with structured RT_FLOW_SESSION_*, the first-path miss with a scoped packet-filter, the plane with show chassis cluster status Redundancy-Group Status, and the VPN with show security ipsec security-associations State and Gateway.”
RFC 5737 / training only. Client 10.10.8.22:51901 on ge-0/0/1.0 (zone trust) to 198.51.100.80:443 on ge-0/0/0.0 (zone untrust). Interface source NAT to 203.0.113.20. Policy allow-app / id 4. Session ID 1042. Cluster ID 1. IPsec remote gateway 203.0.113.50, VPN name BRANCH-VPN, bind-interface st0.0. Confirm live syntax on the installed Junos train before you type on a customer box.
2. Mental model — five proof tools
Memorise five named objects before you type. Each tool is allowed to prove one thing. Over-claiming a field is how you ship a bad commit at 02:00.
1 · show security flow session
Operational CLI. Proves a live session: Session ID, Policy name (first-packet match + id), In / Out Pkts and Bytes, If, Timeout, State. Does not prove a deny that never created a session.
2 · RT_FLOW_SESSION_*
show log on the security log file, or structured syslog. Create / close / deny. Proof fields: policy-name, session-id-32, reason, packets-from-client / packets-from-server. Needs then log session-init / session-close on the matching policy.
3 · flow traceoptions
edit security flow traceoptions with a packet-filter and flag basic-datapath. Or operational monitor security flow (no commit). Proves first-path drop reason. Official caution: disable immediately. Do not run both methods in parallel.
4 · cluster / IPsec SA
show chassis cluster status proves Redundancy-Group Status (Primary / Secondary / Lost / Unavailable). show security ipsec security-associations proves ID, Gateway, State Installed. Empty session table on the wrong node is not a missing permit.
5 · J-Web Monitor
Official path: Monitor → Security → Flow Session (high-end platforms also label Flow Session Statistics). Same session fields as CLI. Monitor → Logs → All Events for RT_FLOW. A dashboard tile is not a proof field.
Hard words, once
Policy name = first packet match, not “the app works.” In = incoming / forward flow. Out = reverse flow. session-init = log when the session is created (or denied). session-close = log when it ends — never fires if no session formed. RG0 = control / RE group. RG1+ = data / RETH groups. They can have different primaries.
Read left → right. Each box is allowed one claim. If you cannot name the field, you are not proving — you are guessing.
I prove the live session, then the syslog event, then the first-path miss, then the plane or the SA. I do not stack a permit, bounce RG0, or leave flag all running until I can quote the field that made me do it.
3. Decision flow — ticket → first tool
Flowchart first. Do not open the policy book until a diamond says so.
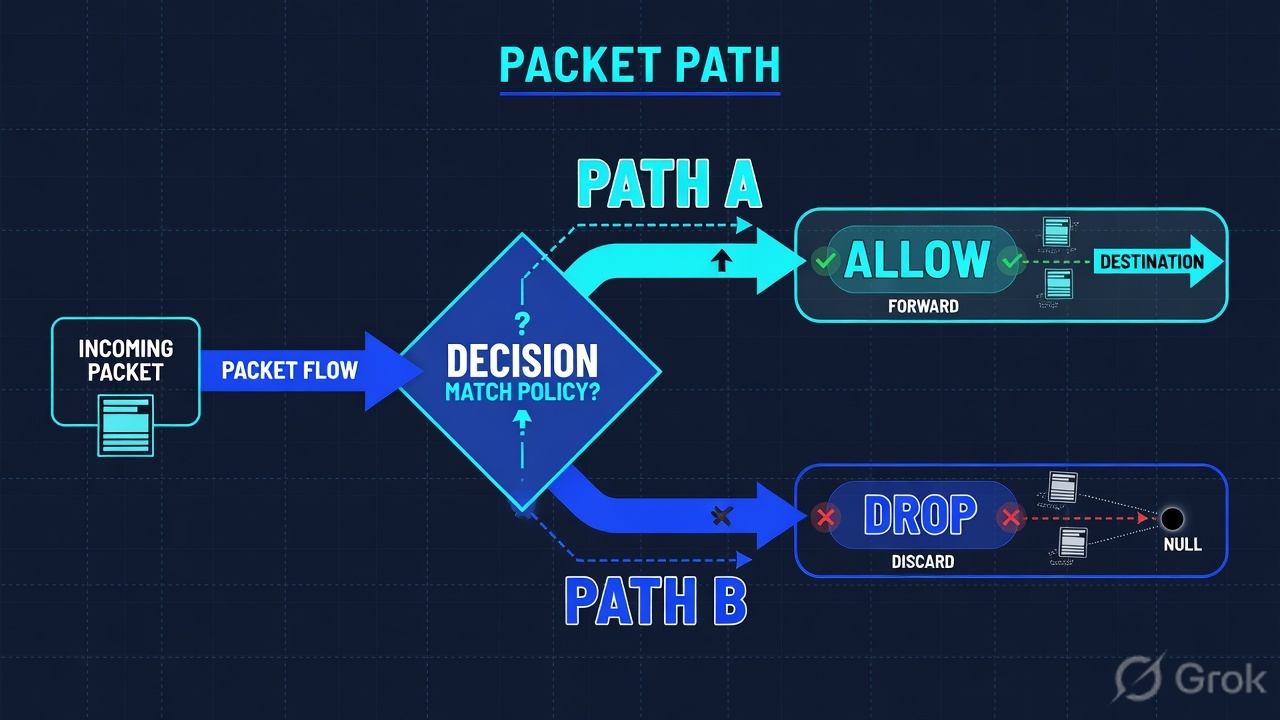
Read the diamond first. A missing reverse packet never starts in the policy book. A dark site after a power event never starts with set security policies. “VPN is down” never starts in junos-https.
4. How to choose — first tool + proof field
Print this next to the console. If you cannot recite the proof field, you are not ready to change anything.
| If the ticket says… | First tool (official path) | Proof field | Do not open first |
|---|---|---|---|
| This HTTPS flow, right now — “firewall is blocking” | show security flow session destination-prefix 198.51.100.80 destination-port 443 (or J-Web Monitor → Security → Flow Session) |
Session ID + Policy name + In / Out Pkts (and If) |
A second trust→untrust permit |
| No session at all; policy book still looks permit | show log on the security log, or SIEM structured syslog — filter RT_FLOW_SESSION_DENY |
policy-name + reason + source-zone-name / destination-zone-name |
clear security flow session all |
| Session existed; now you need bytes both ways after it closed | Same log store — RT_FLOW_SESSION_CLOSE |
packets-from-client / bytes-from-client + packets-from-server / bytes-from-server + reason + session-id-32 |
A new source-NAT pool |
| Whole site dead after a power event / “fail back to node0” | show chassis cluster status (optionally redundancy-group 0 and 1) |
Redundancy-Group + node + Status (Primary / Secondary / Lost / Unavailable) + Preempt + Manual failover |
request chassis cluster failover redundancy-group 0 |
| Branch VPN / “tunnel is down” | show security ike security-associations then show security ipsec security-associations |
IKE State UP / DOWN + IPsec ID + Gateway + State Installed + VPN name + Bind-interface |
A Cloud / URL permit on the internet zone pair |
| Empty session, empty deny log, policy text looks right | set security flow traceoptions packet-filter … + flag basic-datapath, or operational monitor security flow |
The first-path line that names the drop (policy / zone / route / NAT). Then deactivate. | flag all with no packet-filter |
Official output field State is the status of the security flow session in the table. Valid in sample output means the session exists. It does not mean the application completed. Quote Out Pkts (live) or packets-from-server (close log) before you say “the SRX is working.”
5. Runbook Side A → B → C
Side A proves the live session (CLI or J-Web). Side B proves what the box logged. Side C proves the plane, the SA, or the first-path miss. On a messy Sev-2, do them in this order until a field lights up.
Side A — Live session (CLI + J-Web)
-
Filter the 5-tuple. Do not dump the whole table.
Operational mode. Official filters include
destination-prefix,destination-port,source-prefix,source-port,protocol,interface,policy-id,session-identifier, andnodeon a cluster. Privilege:view. Source: Junos OS — show security flow session. -
Quote the four fields that close a “firewall is blocking” ticket
Session ID— number that identifies the session; use it withshow security flow session session-identifierorextensive.Policy name— name and ID of the policy that the first packet matched.In— incoming flow (addresses, protocol,If,Pkts,Bytes).Out— reverse flow, same counters. Source: same CLI reference, Output Fields table. -
Read In/Out before you touch policy
If
Policy nameis a permit andOut Pktsis 0, the factory already allowed the flow. Isolate return path (route, ARP, NAT rewrite on the Out line). If there is no session, do not stay in Side A — go to Side B forRT_FLOW_SESSION_DENY. -
Same table in J-Web if that is all they will accept
Official J-Web: Monitor → Security → Flow Session. On SRX5400 / SRX5600 / SRX5800 the same page is documented as Monitor → Security → Flow Session Statistics. Quote the same CLI field names. J-Web is a view, not a commit. Source: Junos J-Web Help — Monitoring Flow Session Statistics.
Session ID: 1042, Policy name: allow-app/4, Timeout: 1800, Valid
  In: 10.10.8.22/51901 --> 198.51.100.80/443;tcp, Conn Tag: 0x0, If: ge-0/0/1.0, Pkts: 12, Bytes: 1880
  Out: 198.51.100.80/443 --> 203.0.113.20/18422;tcp, If: ge-0/0/0.0, Pkts: 0, Bytes: 0
Total sessions: 1
What you say
Session 1042. First packet matched allow-app id 4. Twelve packets in on ge-0/0/1.0. Zero outbound packets. Out dest 203.0.113.20 is the interface PAT rewrite, not a second client.
What you do not say
“Valid means HTTPS works.” “I will add a permit above allow-app.” Official: Policy name is the first-packet match. Out is the reverse flow. Zero reverse packets is isolate, not change-control.
Monitor / Security / Flow Session
Flow Session
Source: Juniper J-Web Help — Monitoring Flow Session Statistics (Monitor → Security → Flow Session / Flow Session Statistics). Field names match CLI Output Fields: Session ID, Policy name, In, Out, If, Timeout, State. Lab values only. Training mock · not live.
Side B — Structured syslog (create / close / deny)
-
Know what the policy is allowed to write
Session log entries are tied to policy configuration. Each main session event — create, close, and deny — creates a log entry if the controlling policy has logging enabled. Configure
then log session-initand/orthen log session-close. Official note: for the default-permit security policy, RT_FLOW traffic logs are generated when a session ends; session-init is optional. A deny never creates a session, so you needsession-init(or a logged explicit deny) to seeRT_FLOW_SESSION_DENY. Source: Junos OS — Monitoring Security Flow Sessions, “Information Provided in Session Log Entries.” -
Prefer structured-data so the field names are on the wire
Security logs can be BSD syslog, structured syslog, or WELF. Structured form is what SIEM parsers expect:
RT_FLOW - RT_FLOW_SESSION_CREATE [junos@2636.1.1.1.2.26 source-address="…" …]. On-box:show log <filename>— files live under/var/log/. Source: Junos OS — Configure System Logging for Security Devices. -
Quote the fields that close the ticket
Create:
policy-name,session-id-32,source-zone-name,destination-zone-name,nat-source-address,src-nat-rule-name,packet-incoming-interface. Close: addreason,packets-from-client,bytes-from-client,packets-from-server,bytes-from-server,elapsed-time. Deny:policy-nameis “the name of the policy that denied the session creation” plusreason. Source: same session-log tables.
RT_FLOW - RT_FLOW_SESSION_CREATE [junos@2636.1.1.1.2.26
  source-address="10.10.8.22" source-port="51901"
  destination-address="198.51.100.80" destination-port="443"
  service-name="junos-https"
  nat-source-address="203.0.113.20" nat-source-port="18422"
  nat-destination-address="198.51.100.80" nat-destination-port="443"
  src-nat-rule-name="PAT-OUT" dst-nat-rule-name="None" protocol-id="6"
  policy-name="allow-app" source-zone-name="trust" destination-zone-name="untrust"
  session-id-32="1042" packet-incoming-interface="ge-0/0/1.0"]

RT_FLOW - RT_FLOW_SESSION_CLOSE [junos@2636.1.1.1.2.26
  reason="TCP FIN" … session-id-32="1042"
  packets-from-client="12" bytes-from-client="1880"
  packets-from-server="0" bytes-from-server="0" elapsed-time="18"
  packet-incoming-interface="ge-0/0/1.0"]

RT_FLOW - RT_FLOW_SESSION_DENY [junos@2636.1.1.1.2.26
  source-address="10.10.8.22" destination-address="198.51.100.80"
  destination-port="443" service-name="junos-https" protocol-id="6"
  policy-name="None" source-zone-name="trust" destination-zone-name="untrust"
  reason="policy deny" session-id-32="0"
  packet-incoming-interface="ge-0/0/2.0"]
Monitor / Logs / All Events · event ID RT_FLOW
All Events
| Event | policy-name | session-id-32 | reason | pkts c / s |
|---|---|---|---|---|
| SESSION_CREATE | allow-app | 1042 | — | — |
| SESSION_CLOSE | allow-app | 1042 | TCP FIN | 12 / 0 |
| SESSION_DENY | None | 0 | policy deny | — |
Source: Junos OS — Information Provided in Session Log Entries for SRX Series (RT_FLOW_SESSION_CREATE / CLOSE / DENY field names). J-Web Monitor → Logs → All Events is a view of the same event IDs. Lab identities only. Training mock · not live.
Side C — Plane, SA, or first-path trace
-
Name the redundancy group before you trust an empty table
show chassis cluster status(optionalredundancy-group <n>). QuoteCluster ID,Redundancy-Group, node (node0/node1),Priority,Status(Primary — active and passing traffic; Secondary — passive; Lost — control-link contact lost; Unavailable — no heartbeat since the peer booted),Preempt,Manual failover,Monitor-failures. Official: a redundancy group is primary on one node and secondary on the peer. RG0 and RG1+ can differ. Source: Junos OS — show chassis cluster status Output Fields. -
If the ticket is a site-to-site VPN, prove the SA, not the internet policy
First
show security ike security-associations. Official meaning:Remote Addressmust be the peer;StateUPmeans the IKE SA is established;DOWN(or no row) means Phase 1 failed. Thenshow security ipsec security-associations. QuoteID(use it withindex/detail),Gateway,Port(500, or 4500 if NAT-T),VPN name,StateInstalled / Not Installed,Local gateway/Remote gateway,Bind-interface. If the remote gateway is not listed, the IPsec SA is not active. Source: Junos OS — Troubleshoot a VPN Tunnel That is Down; show security ipsec security-associations. -
Last resort: scoped flow trace, then tear it down
Official hierarchy:
edit security flow traceoptions. Setfile(under/var/log),flag basic-datapath(andsessionif you need create/delete), and apacket-filterusingdestination-prefix,destination-port,source-prefix,source-port,protocol,interface.trace-level briefis documented for policy match and packet drop reasons. Thenshow log <file>. Official caution: tracing can impact scale and security — disable immediately after collection. Operational alternative:monitor security flow filter+file+start/stop— no commit, but it cannot run in parallel with flow traceoptions. Source: Junos OS — traceoptions (Security Flow); Configure Data Path Debugging; Monitoring Security Flow Sessions Overview.
show chassis cluster status
Cluster ID: 1
Node                  Priority Status         Preempt Manual failover
Redundancy group: 0 , Failover count: 1
    node0                  200 primary             no      no
    node1                  100 secondary           no      no
Redundancy group: 1 , Failover count: 1
    node0                  200 primary             no      no
    node1                  100 secondary           no      no

show security ike security-associations
Index   State  Mode           Remote Address
1       UP     IKEv2          203.0.113.50

show security ipsec security-associations
Total active tunnels: 1
  ID     Algorithm           SPI      Life:sec/kb  Mon  Port  Gateway
  131073 ESP:aes-256/sha256  …        28744/unlim   -    500   203.0.113.50

show security ipsec security-associations index 131073 detail
  VPN name: BRANCH-VPN
  State: Installed
  Local gateway: 203.0.113.1
  Remote gateway: 203.0.113.50
Bind-interface: st0.0edit security flow traceoptions set file flow-trace size 10m files 3 set flag basic-datapath set packet-filter FINANCE-443 protocol tcp set packet-filter FINANCE-443 destination-prefix 198.51.100.80/32 set packet-filter FINANCE-443 destination-port 443 commit … reproduce one flow … show log flow-trace deactivate security flow traceoptions commit
- Side A: same
Session IDshowsOut Pktsincrementing (or J-Web Flow Session shows the same pair).Policy nameis the intended permit. - Side B:
RT_FLOW_SESSION_CLOSEfor thatsession-id-32haspackets-from-server> 0. A deny ticket quotespolicy-name+reason= policy deny. - Side C: you are on the data-plane
Redundancy-GroupwhoseStatusis Primary. IPsecStateis Installed on the intendedGateway. Any traceoptionspacket-filteris deactivated.
6. Five tickets as full stories
These five land every quarter. Memorise first tool + proof field. Times and addresses below are lab-only.
| Ticket | Symptom | First tool | Proof field |
|---|---|---|---|
| SRX-EVD-01 | Finance HTTPS spins; last engineer already cloned the permit | show security flow session | Policy name permit + In Pkts > 0 + Out Pkts = 0 |
| SRX-EVD-02 | No session; policy book still looks correct | structured RT_FLOW_SESSION_DENY | policy-name + reason + zones + packet-incoming-interface |
| SRX-EVD-03 | After a power event, empty table on node0; “fail back” | show chassis cluster status | RG0 and RG1 Status named separately |
| SRX-EVD-04 | Branch prefix via st0.0 dead after a peer change | show security ike then ipsec security-associations | IKE State + IPsec State Installed + Gateway |
| SRX-EVD-05 | Empty session, empty deny log, policy text looks right | scoped security flow traceoptions packet-filter | First-path drop line, then deactivate |
SRX-EVD-01 — Prove the live session (In / Out)
02:14 · P2. Browser spins to 198.51.100.80. L1 already cloned allow-app. Someone wants a third permit.
First tool: show security flow session destination-prefix 198.51.100.80 destination-port 443.
Proof field: Session ID 1042, Policy name allow-app/4, In Pkts 12, Out Pkts 0, Out dest 203.0.113.20 (interface PAT). That is a return-path isolate, not a policy miss. Next isolate commands — still read-only — are the route and ARP for the next hop, and show security nat source rule only to confirm Action and hits, not to disable PAT.
I would not add a permit. I would paste Session ID 1042, Policy name allow-app/4, In 12, Out 0. Change-control is not a third line in trust→untrust.
Forgetting that the Out destination is the PAT’d client makes people “fix” NAT that is working. Interface source NAT is documented: sessions using that interface address refresh if the interface IP changes — verify with the same show security flow session command.
SRX-EVD-02 — Prove the deny (RT_FLOW_SESSION_DENY)
02:28 · P2. A VLAN cutover at 01:00. Policy book still shows allow-app from trust to untrust. No session forms. L1 wants permit any any.
First tool: structured log / show log filtered on RT_FLOW_SESSION_DENY for that source and UTC window. J-Web: Monitor → Logs → All Events, event family RT_FLOW.
Proof field: policy-name (officially: the policy that denied session creation — often None on implicit deny), reason = policy deny, source-zone-name / destination-zone-name, packet-incoming-interface. If the cutover put the user VLAN on ge-0/0/2.0 in another zone, this context is the wrong book. Redraw show security zones before you edit trust→untrust.
I would quote RT_FLOW_SESSION_DENY policy-name + reason + ingress interface. If the zone bind is wrong, that is change-control on the zone, not another line in the old pair. If logging was never enabled, say that — do not invent a deny from an empty file.
host-inbound-traffic system-services on a zone is not a transit permit. Session-close will not fire for a deny. If nobody configured session-init, the empty log is expected — that is when Side C traceoptions earns its keep.
SRX-EVD-03 — Prove the plane (chassis cluster)
02:40 · P1. After a power event, apps fail. Someone says “fail back to node0.” You have not named a redundancy group.
First tool: show chassis cluster status.
Proof field: Redundancy-Group 0 and 1, each node’s Status, Preempt, Manual failover. “node0 is primary” without a group name is a junior answer — RG0 (RE) and RG1+ (data) can have different primaries. Official Lost vs Unavailable are different control-link stories. Manual failover of RG0 is documented change-control with process-restart risk — not a night-shift reboot.
I would verify I am on the current data primary before changing policy. If RG1 is primary on node1, I would re-run show security flow session there (or node primary). I would not type request chassis cluster failover redundancy-group 0 to “refresh” the RE.
SRX-EVD-04 — Prove the SA (IKE + IPsec)
02:55 · P1. Branch prefix via st0.0 died after a 02:00 peer change. L1 wants a new trust→untrust permit for the branch net.
First tool: show security ike security-associations, then show security ipsec security-associations. If the remote gateway is missing, the IPsec SA is not active — official VPN-down runbook.
Proof field: IKE State UP or DOWN + Remote Address. IPsec ID, Gateway, Port (500 vs 4500), State Installed, VPN name, Bind-interface. An Installed SA with zero flow sessions is a route / traffic-selector / proxy-id ticket, not a missing internet permit. A missing IKE row is Phase 1 (proposal, PSK, UDP 500/4500) — isolate toward the peer, not the policy book.
Mon is VPN monitoring status (U / D / hyphen / V), not “the application is up.” Life: sec/kb is SA lifetime, not a session timeout. Do not quote either as user-traffic proof.
SRX-EVD-05 — Prove the first path (traceoptions)
03:10 · P2. Empty session table. Empty RT_FLOW_SESSION_DENY (logging was never set on the implicit deny). Policy text looks right. Someone typed Sev-1.
First tool: a scoped security flow traceoptions packet-filter with flag basic-datapath, or operational monitor security flow if you do not want a commit. Official filter keys: destination-prefix / destination-port / protocol (and source / interface if you have them). Official trace-level brief is the drop-reason view.
Proof field: the first-path line that names why the packet died (zone, policy lookup, route, NAT). Then deactivate security flow traceoptions and commit — or monitor security flow stop. Leaving flag all without a filter is how you melt a production SRX.
I would paste the drop line and the UTC I enabled and disabled the filter. I would not leave tracing on. I would not run monitor security flow and configuration traceoptions at the same time — official docs say those two operations cannot run in parallel.
7. Traps + close-the-ticket proof
| You see | Weak close | Strong close |
|---|---|---|
| Policy name permit, Out Pkts 0 | Add another permit | Quote Session ID + In/Out; isolate ARP / route / return |
| State Valid | “The SRX is working” | Valid is table membership. Quote Out Pkts or packets-from-server |
| Empty session table | permit any any | RT_FLOW_SESSION_DENY, or cluster Status, or scoped packet-filter |
| Empty deny log | “Nothing was denied” | session-init was never set. Say that. Then Side C. |
| PAT-OUT hits climbing | Disable source NAT | Out dest already shows the rewrite. Hits mean the rule is matching |
| “node0 is primary” | Fail RG0 to refresh the RE | Name RG0 and RG1 Status separately. Manual failover is change-control |
| IPsec Mon = hyphen | “Tunnel monitoring is down” | Hyphen means monitoring is not enabled. Quote State Installed + Gateway |
| junos-https in the policy | “Salesforce is allowed” | junos-https is TCP/443, not a SaaS AppID. Quote the session or the log |
| host-inbound-traffic ssh | Add more system-services to fix HTTPS | Wrong object. Transit is a from-zone/to-zone policy |
| flag all, no packet-filter | Leave it overnight “just in case” | Official caution: disable immediately after collection |
- UTC window written next to the tool you opened. Logical-system / tenant stated if used.
- If the flow is live:
Session ID,Policy name,In Pkts,Out Pkts, bothIfvalues in the ticket. - If the flow already ended:
RT_FLOW_SESSION_CLOSEsession-id-32+packets-from-client/packets-from-server+reason. - If there was no session:
RT_FLOW_SESSION_DENYpolicy-name+reason, or an explicit note that session-init is off. - If the table is empty after HA: RG0
Statusand RG1+Statusnamed. You re-checked the data primary. - If the ticket is a VPN: IKE
Stateand IPsecState/Gateway/Bind-interface. - If you enabled traceoptions or
monitor security flow: start time, stop time, anddeactivate/stopcommitted or issued. - Interview close sentence written. Bucket chosen: isolate or change-control.
I name the question, then the first tool, then one official field. show security flow session proves the live session. Structured RT_FLOW_SESSION_* proves create / close / deny. A scoped packet-filter proves the first-path miss. show chassis cluster status proves which redundancy group is Primary. show security ipsec security-associations proves the SA is Installed. I do not stack a permit, bounce RG0, or leave tracing on until that field is on the ticket. Factory model: SRX session factory.
Knowledge check
Six night-shift judgments. Each maps to a first tool or a proof field. Check answers, then Reset if you picked the wrong surface.
Sources
- Junos OS — show security flow session (
Session ID,Policy name,In,Out,If,Pkts,Bytes,Timeout,State, filters includingdestination-prefix,session-identifier,node) - Junos OS — Monitoring Security Flow Sessions (filters;
monitor security flowstart/stop; cannot run in parallel with flow traceoptions; session-init / session-close; structuredRT_FLOW_SESSION_CREATE/CLOSE/DENYfields includingpolicy-name,session-id-32,reason,packets-from-client,packets-from-server,packet-incoming-interface) - Junos OS — Configure System Logging for Security Devices (BSD / structured syslog / WELF; default-permit generates RT_FLOW on session end; J-Web Monitor → Reports → Traffic)
- Junos OS — traceoptions (Security Flow) (
packet-filterkeys;flag basic-datapath/session;trace-level brieffor policy match and packet drop reasons; official disable caution) - Junos OS — Configure Data Path Debugging and Trace Options (flow traceoptions packet-filter combinations)
- Junos OS — show chassis cluster status (
Cluster ID,Redundancy-Group,Priority,StatusPrimary / Secondary / Lost / Unavailable,Preempt,Manual failover,Monitor-failures) - Junos OS — Chassis Cluster Redundancy Groups
- Junos OS — Chassis Cluster Redundancy Group Failover (primary on one node, secondary on the peer;
request chassis cluster failover) - Junos OS — show security ipsec security-associations (
ID,Gateway,Port,StateInstalled,VPN name,Local gateway/Remote gateway,Bind-interface,Mon) - Junos OS — show security ike security-associations
- Junos OS — Troubleshoot a VPN Tunnel That is Down (missing remote gateway ⇒ IPsec SA not active; IKE
StateUP / DOWN) - Junos J-Web Help — Monitoring Flow Session Statistics (Monitor → Security → Flow Session Statistics on SRX5400/5600/5800; Monitor → Security → Flow Session on other SRX)
- Junos OS — Configuring Security Policies (session-init / session-close logging notes)
- Junos OS — Source NAT
- Junos OS — Security Zones
Related: Blog 1 · SRX session factory · SRX architecture — planes, zones, commit · Juniper SRX practice hub · All lessons