Site status answers “is this website even on Imperva?” Security Events answers “did a security rule fire on this session — and what did we do?” WAF Policies answers “which WAF Rules policy is attached, and what is this rule’s mitigation?” Action answers Block Request versus Alert Only versus Ignore — they are not the same 403. The log answers “can I paste a SIEM-grade row (cs-rule, cs-attacktype, sc-status, cs-uri)?” A green dashboard tile is not an event. An Alert Only row is not a block.
1. Why “is it working?” is five questions
Operators collapse five failures into one sentence. DNS never finished, so the site is not Fully configured. A WAF rule blocked /search. Last night’s policy save set SQL Injection to Block Request and nobody read it. The event is Alert Only and the 403 is something else. The SIEM never received a Security log. Those are five first clicks.
This page is the night-shift desk for proof. The factory taught the exchange: a 403 can be the product succeeding. Here you learn the five Cloud Security Console tools you actually open, in order, when someone asks you to prove Imperva is working — or to say why this request was blocked.
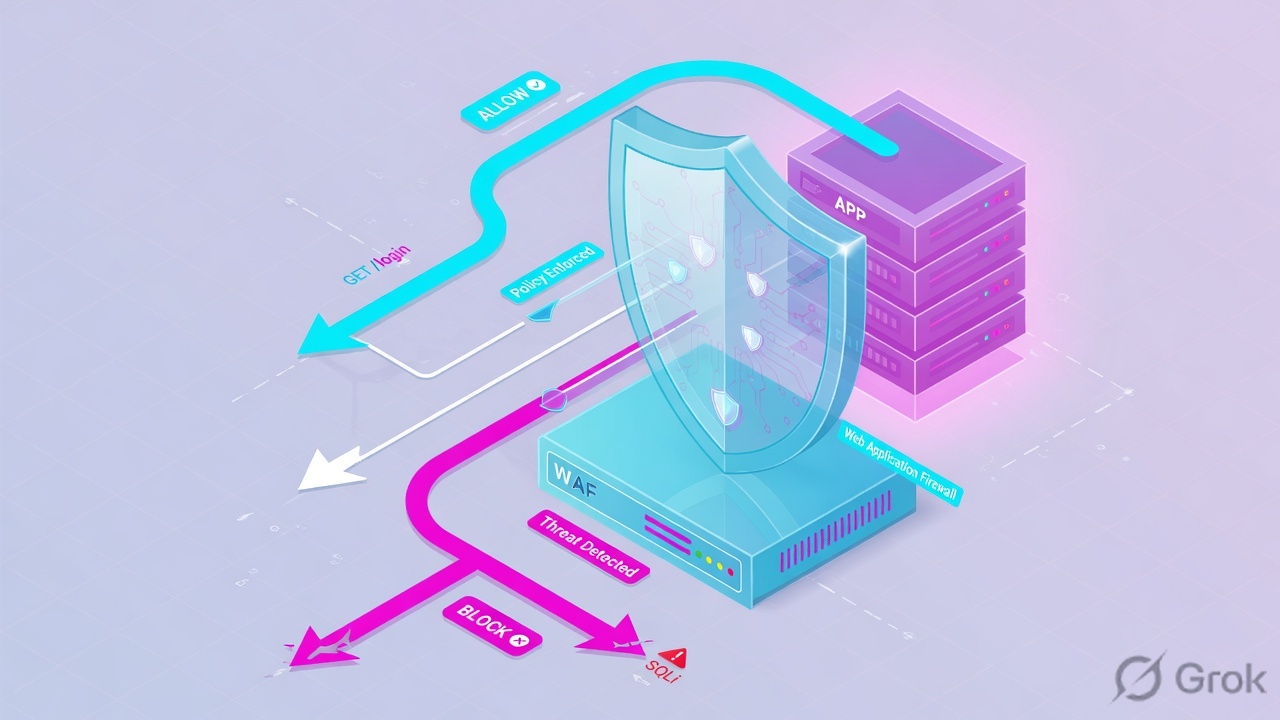
If they say “prove Imperva is working,” do not say “I opened my.imperva.com.” Say: “I prove the site is Fully configured, the session on Security Events, the attached WAF Rules policy and its mitigation, the Action (Block Request versus Alert Only), and the SIEM row. I do not disable a rule until that field is on the ticket.”
2. Mental model — five proof tools
Memorise five named objects before you click. Each tool is allowed to prove one thing. Over-claiming a field is how you ship a bad change at 02:00.
1 · Site status
Cloud Security Console · top bar Application · sidebar Websites. Official values: Fully configured, Partially configured, Not configured, Disabled. Proves whether traffic to this website is protected. Does not prove which rule fired.
2 · Security Events
Application → sidebar Security Events. Events are created when a security rule is triggered. View events per session, then drill into requests. Proves Action + violation type. Official Help also documents an Incident ID on the error page.
3 · WAF Policies
Application → WAF > WAF Policies. Each account has a default WAF Rules policy, auto-applied to new websites. Each rule has a mitigation. Proves which policy is live and how that rule is supposed to respond.
4 · Action
The field on the event, and the mitigation on the policy. Official policy options include Block Request (default for most WAF rules), Alert Only, and Ignore (Sensitive Information Leakage default). Alert Only still writes a Security Event. It is not a 403.
5 · Log
Account > Account Management → SIEM Logs > Log Configuration for Security Logs / Access Logs. Official W3C fields: cs-uri, cs-rule, cs-attacktype, cs-attackid, s-ruleName, sc-status, c-ip. Application → Activity Log is account activity. Audit Trail is who changed the policy.
Hard words, once
Cloud Security Console = my.imperva.com. WAF Sessions = the Security Events grouping. Mitigation level = how the WAF rule responds. Incident ID = the error-page handle you filter on. cs-attacktype codes include 0 SQL Injection, 1 Cross Site Scripting, 3 Illegal Resource Access, 4 Bot Access Control.
Read left → right. Each box is allowed one claim. If you cannot name the field, you are not proving — you are guessing.
I prove the site is on the path, then the session, then the attached policy and rule, then the Action, then the log row. I do not set a mitigation to Ignore, add an exception, or release a blocked session until I can quote the field that made me do it.
3. Decision flow — ticket → first tool
Flowchart first. Do not open WAF Policies to Disable a rule until a diamond says so.
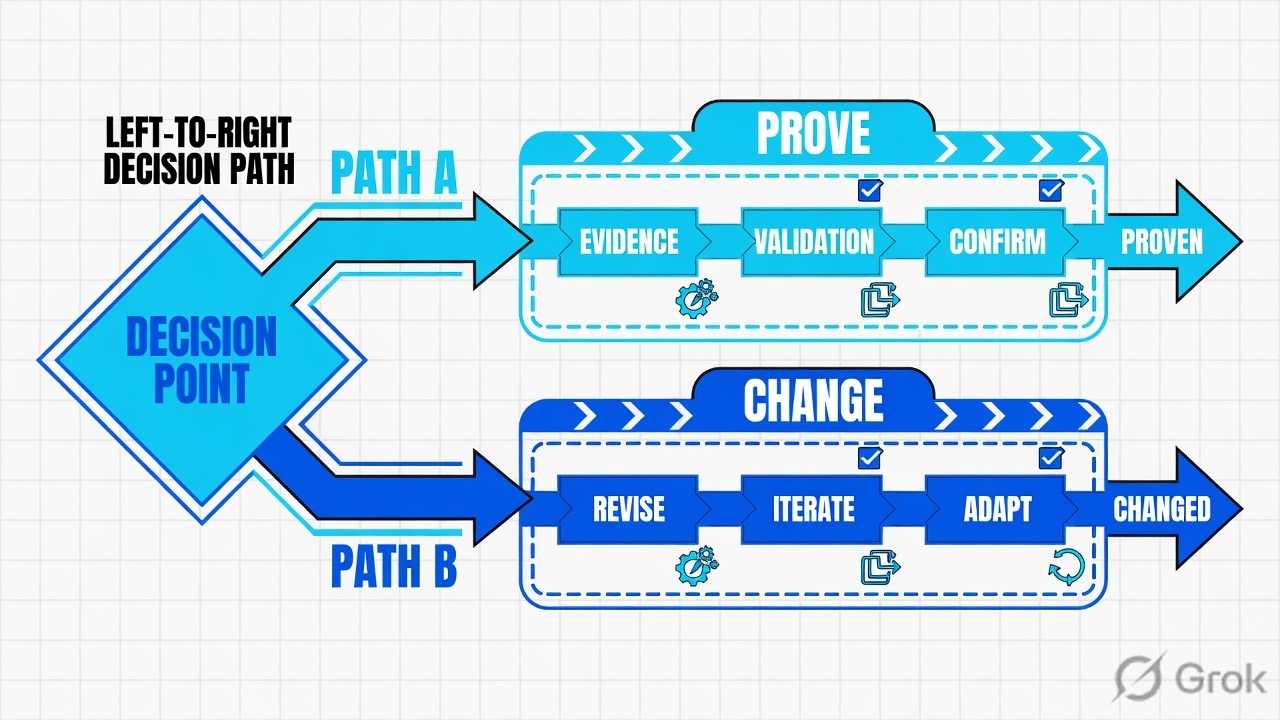
Read the diamond first. A whole-site outage after DNS never starts in SQL Injection. Alert Only never starts as “turn Imperva off.” Empty Security Events never starts as a new exception.
4. How to choose — first tool + proof field
Print this next to the Cloud Security Console. If you cannot recite the proof field, you are not ready to change a mitigation.
| If the ticket says… | First tool (official path) | Proof field | Do not open first |
|---|---|---|---|
| “Is Imperva even working?” / whole site after a DNS change | Application → Websites → the website | Site status: Fully configured (protected and accelerated) · Partially configured · Not configured · Disabled | A new WAF exception |
| “Why was this request blocked?” / user pasted an error page | Application → Security Events (WAF Sessions, then the request) | Action + violation type / rule + Incident ID (filter from the error page) |
Origin Servers, Client-Side Protection |
| After a policy save / “who changed SQL Injection?” | Application → WAF > WAF Policies, then Account → Account Management → Audit Trail | Policy name + that rule’s mitigation level + Audit Trail entry for the WAF Rules policy | A site-wide Disable |
| “Imperva blocked us” but the page still loaded | Same Security Events row — read Action | Alert Only (event + notify) versus Block Request versus Ignore | Release Blocked Sessions |
| SOC wants a SIEM paste / “did we even log it?” | Account → SIEM Logs > Log Configuration, then the Security / Access file | cs-rule + cs-attacktype + sc-status + cs-uri + c-ip (+ s-ruleName on security events) |
A screenshot of the 403 tab |
Website status indicates DNS configuration for the first domain only. It does not reflect DNS of additional domains or SSL coverage for the whole site. If the ticket names a second hostname, do not treat Fully configured on the primary as proof that hostname is on Imperva.
5. Runbook Side A → B → C
Side A proves the website is on the path and whether a security rule fired. Side B proves the attached WAF Rules policy and the Action. Side C proves the log row and who changed what. On a messy Sev-2, do them in this order until a field lights up.
Side A — Website, then Security Events
-
Prove the website is Fully configured
Log in to the Imperva Cloud Security Console. Top menu bar: Application. Sidebar: Websites. Open the site on the ticket. Official status values (Web Protection — Websites): Fully configured — traffic is protected and accelerated. Partially configured — traffic is not completely secured (DNS and/or SSL incomplete). Not configured — none of the website’s domains are fully configured. Disabled. If the status is not Fully configured, stop. There is no WAF Action to hunt yet.
-
Open Security Events, not the policy editor
Same Application menu. Sidebar: Security Events. Official: the page displays a log of security events detected by Imperva; events are created when a security rule is triggered; you view events per session, then drill into specific requests. Filter the website + the UTC window on the ticket. If the user pasted an error page, filter the Incident ID (Cloud WAF Error Pages and Codes).
-
Read the session, then the request
Help groups these as WAF Sessions. The WAF Sessions by violation type quick filter is the pointer. The request is the proof. Quote Action, violation type (SQL Injection, Cross Site Scripting, Illegal Resource Access, Remote File Inclusion, Backdoor Protect, Application Level DDoS, Bot Access Control, custom), URL, and source IP. Official next clicks on that row include Add an exception to the WAF Rules policy and Edit directly in policy — both are writes. Isolate first.
-
If Security Events is empty, do not invent a rule
Empty is a result. Go back to site status. Or the matching rule is Ignore (no useful event). Or the request never reached a POP. Access Logs (every request) are the next read — Security Logs only exist for suspicious events.
Application / Security Events / WAF Sessions
Security Events
| Time (UTC) | URL | Violation | Action | Source IP |
|---|---|---|---|---|
| 01:38:11 | /login | Cross Site Scripting | Alert Only | 203.0.113.40 |
| 01:41:04 | /search | SQL Injection | Block Request | 203.0.113.88 |
Source: Imperva Help — View Security Events (Application → Security Events; events per session; Add an exception to the WAF Rules policy; Edit directly in policy). Incident ID: Cloud WAF Error Pages and Codes. Lab website and TEST-NET-3 addresses only. Training mock · not live.
Side B — WAF Policies, then Action
-
Open the attached WAF Rules policy, not a cousin
Path: Application → sidebar WAF > WAF Policies. Official: each account and sub-account includes a default WAF Rules policy, automatically applied to new websites. You can create a maximum of 1,000 policies. Confirm the policy attached to this website before you argue about a mitigation.
-
Read the rule’s mitigation — that is the Action the engine was told to take
Create and Manage Policies: each WAF rule addresses a different threat; for each rule you set a mitigation level. Current Help default: WAF rules are set to Block Request, except Sensitive Information Leakage which defaults to Ignore. The Customer Setup Checklist still documents Cross-Site Scripting historically defaulting to Alert Only. Quote what the live policy shows tonight — do not recite a PDF from memory.
-
Treat Action as its own proof field
WAF Settings: Alert Only sends a notification (per WAF / notification settings) and an alert appears on Security Events. It does not mean Block Request. Ignore is how a rule goes quiet. If the event Action is Alert Only and the user got a 403, you are looking at a different rule — or at origin. Help also documents Bot Access Control actions on the same Security Events page (for example Add to Bad Bots). That is not SQL Injection.
-
The per-site WAF page still exists — know which one you opened
Older / still-documented path: Application → Websites → site → Website Settings → WAF. Official note on that page: most WAF settings are now managed by the WAF Rules policy feature. Use WAF Policies as the source of truth for mitigation. Use Website Settings → WAF when Help for a leftover control still points there.
Application / WAF / WAF Policies / Finance-Baseline
WAF Rules policy · Finance-Baseline
| WAF rule | Mitigation level | Notes |
|---|---|---|
| SQL Injection | Block Request | Default for most rules |
| Cross Site Scripting | Alert Only | Confirm live — docs disagree by age |
| Illegal Resource Access | Block Request | Default |
| Remote File Inclusion | Block Request | Default |
| Sensitive Information Leakage | Ignore | Documented default on Policies |
Source: Imperva Help — Create and Manage Policies (Application → WAF > WAF Policies; default WAF Rules policy; Block Request default; Sensitive Information Leakage → Ignore). Customer Setup Checklist still documents XSS → Alert Only. Confirm the mitigation on the policy you will touch. Training mock · not live.
View Security Events offers Add an exception to the WAF Rules policy for requests that violated that policy. Troubleshoot False Positives: the WAF Rules policy defines how Cloud WAF responds; you mitigate a specific type of request rather than turning the site off. Factory lesson: exception dimensions are URL, HTTP Parameter, IP, Country, Client App ID — not “SQL Injection = Disabled.”
Side C — Log, Activity Log, Audit Trail
-
Confirm SIEM logging is even on
Path: top bar Account > Account Management → sidebar SIEM Logs > Log Configuration. Official modes: Security Logs (a detailed alert for each suspicious event), Security Logs and Access Logs (every request and response, plus security events), or None. If the mode is None, there is no SIEM row to paste. Cloud WAF customers can still read past events on Security Events (Help: 90 days) or via the API.
-
Quote official log fields, not a screenshot
Log File Structure / Example Logs (W3C):
cs-uri,cs-uri-query,sc-status,c-ip,cs-rule,cs-severity,cs-attacktype,cs-attackid,s-ruleName,cs-ruleInfo. Security events contain all access-event fields and more. Attack-type codes documented with the log: SQL Injection 0, Cross Site Scripting 1, Illegal Resource Access 3, Bot Access Control 4, Sensitive Information Leakage 6, DDoS 8, Backdoor Protect, Remote File Inclusion. -
Activity Log is not Audit Trail
Application → Activity Log — select a time range; this is application activity in the console. Account > Account Management → Account Management > Audit Trail — log of actions by account users, system processes, and Imperva administrators. Official example shape:
WAF Rules Policy "policy1" (ID: …). Use Audit Trail when the ticket is “it worked this morning.” -
Origin only after an Allow
If Action is not Block Request and the user still has an error, open Website Settings → Origin Servers (also the Connectivity Report: tests run for each origin defined on Websites → Settings → Origin Servers). Healthy origin + Block Request = stay on the event. 502 after allow = origin team.
Website:         finance.lab.example
Site status:     Fully configured
Path:            Application → Security Events
Incident ID:     2048-LAB
Quote:           Action = Block Request · violation = SQL Injection · URL = /search
Policy path:     Application → WAF → WAF Policies → Finance-Baseline
Mitigation:      SQL Injection = Block Request
Log row:         cs-attacktype=0 cs-rule=… sc-status=403 cs-uri=/search c-ip=203.0.113.88
If empty event:  re-read site status · or SIEM mode = None
If “who changed”: Account → Audit Trail · WAF Rules Policy name + time
- Side A site: Websites shows Fully configured for the hostname on the ticket (remember: first domain only). Side A session: Security Events names Action + violation type + Incident ID.
- Side B: WAF Policies shows the attached policy and the live mitigation. Event Action matches that mitigation — or you can explain why it does not.
- Side C: SIEM mode is not None. You can paste
cs-rule+sc-status+cs-uri. Audit Trail names the last policy save if the ticket is “who changed it.”
6. Five tickets as full stories
These five land every quarter. Memorise first tool + proof field. Times and identities below are lab-only.

| Ticket | Symptom | First tool | Proof field |
|---|---|---|---|
| IEVD-01 | “Is Imperva even working?” after a DNS change | Application → Websites | Site status Fully configured / Partial / Not configured / Disabled |
| IEVD-02 | User pasted an Imperva error page for /search | Application → Security Events | Action + violation type + Incident ID |
| IEVD-03 | After last night’s policy save, search 403s | WAF → WAF Policies (+ Audit Trail) | SQL Injection mitigation + Audit Trail policy entry |
| IEVD-04 | “Imperva blocked us” but the page still loaded | Security Events → Action | Alert Only versus Block Request versus Ignore |
| IEVD-05 | SOC wants a SIEM paste; console event exists | SIEM Logs → Security / Access file | cs-rule + cs-attacktype + sc-status + cs-uri |
IEVD-01 — Prove the site is on Imperva (site status)
01:42 · P2. Priya: “finance is down, Imperva is broken.” Someone already drafted a SQL Injection exception. A colleague’s Fully configured screenshot is from www, not the hostname on the ticket.
First tool: Application → Websites → the website named in the ticket.
If Not configured or Partially configured: traffic is not completely secured. Official definitions: Fully configured means traffic is protected and accelerated; Partial means DNS and/or SSL is incomplete; Not configured means none of the domains are fully configured. Quote the status. Next check is DNS / SSL for that first domain — not a WAF rule.
If Fully configured: you proved the website object is on the path. You did not prove which rule fired. Now you are allowed to open Security Events for that website and UTC window. Status still does not cover additional domains.
Do not trust a Fully configured badge from a different website or from the first domain when the ticket names a second hostname. Do not disable a WAF rule to “test if Imperva is in the path.”
IEVD-02 — Prove why this request was blocked (Security Events)
02:05 · P2. QA pasted 1'or'1'='1 into production search. Nearby users saw the Imperva error page. App wants “Imperva off until standup.”
First tool: Application → Security Events. Filter website = finance.lab.example, Incident ID from the error page, last hour. Open the WAF Session, then the request.
Proof field: Action = Block Request, violation type = SQL Injection, URL = /search, source IP = 203.0.113.88. That name is the ticket. A 403 here can be the product succeeding — the factory lesson. Contain the tester. An exception on URL + HTTP Parameter is change-control after a proven false positive, not the first click.
I would not Disable SQL Injection on the default policy. I would quote Action + violation type + Incident ID. Help’s own next buttons (Add exception, Edit directly in policy, Release Blocked Sessions) are writes — isolate first.
IEVD-03 — Prove the policy and the mitigation (WAF Policies)
02:20 · P1. Search 403s for everyone since a 21:00 policy save. Security Events already shows SQL Injection / Block Request. L1 wants the default policy detached.
First tool: Application → WAF > WAF Policies → the policy applied to this website. Read SQL Injection mitigation. Then Account → Account Management → Audit Trail for that WAF Rules policy name and time.
Proof field: attached policy = Finance-Baseline, SQL Injection = Block Request, Audit Trail shows ops@lab.example saved the policy at 21:00Z. Defaults matter: most rules Block Request; Sensitive Information Leakage defaults to Ignore. If last night someone moved SQL Injection from Alert Only to Block Request, that is the change — not “Imperva is down.”
Quote the mitigation and the Audit Trail row. Roll back that one rule under change-control if the save was unintended. Detaching the default policy also unblocks every other attack type on every new site that inherits it.
IEVD-04 — Prove the Action (Alert Only is not a block)
02:40 · P3. App: “Imperva blocked the login page.” The page actually loaded. Someone is about to click Release Blocked Sessions on a different user.
First tool: the same Security Events row — read Action before you touch a session.
Proof field: Action = Alert Only on Cross Site Scripting for /login. Official meaning (WAF Settings): a notification is sent and an alert appears on Security Events. That is not Block Request. If a real 403 exists, it belongs to a different request — filter Incident ID, or look at Bot Access Control (attack type 4), not the XSS Alert Only row.
Release Blocked Sessions (Application → Security Events → WAF Sessions → ellipsis on a blocked session) is a write for a session that was actually blocked. It does not fix an Alert Only ticket and it does not fix site status Partial.
IEVD-05 — Prove the log row (SIEM / Access / Security)
03:00 · P3. SOC: “paste the log or it did not happen.” Security Events already shows the Block Request. SIEM is empty.
First tool: Account → Account Management → SIEM Logs > Log Configuration. Read the mode.
Proof field: if mode is None, quote that — there is no file to ship. If mode is Security Logs (or Security and Access), paste cs-attacktype=0, cs-rule, s-ruleName, sc-status, cs-uri=/search, c-ip=203.0.113.88. A screenshot of the 403 tab is not a W3C row. Activity Log is console activity, not the HTTP transaction. Audit Trail is who saved the policy, not the request.
I would leave the WAF rule alone. I would paste the SIEM mode and one official field set. If events exist in console for 90 days but SIEM is None, that is a logging ticket — not a mitigation ticket.
7. Traps + close-the-ticket proof
These are the sentences that turn a contained SQLi test into an open origin. Weak close versus strong close.
| You see | Weak close | Strong close |
|---|---|---|
| Site status Partial / Not configured | “Imperva is down” / Disable SQL Injection | Quote official status text; finish DNS / SSL; remember first-domain-only |
| Site status Fully configured, still failing | “Imperva is fine” | You only proved the website object. Open Security Events for that URL. |
| Alert Only on Security Events | “Zscaler— wait, Imperva blocked us” | Alert Only is notify + event. Hunt Block Request on another request if they truly got 403. |
| Empty Security Events | A WAF rule must have blocked everything | Site status first. Then SIEM mode. Then whether the rule is Ignore. |
| Default WAF Rules policy exists | Detach it so search works | Read the one rule’s mitigation. New sites inherit the default. |
| WAF Sessions “Release session” | Release everyone to test | Only a blocked session, and only as a write after isolate |
| Bot Access Control event (type 4) | Disable SQL Injection | Stay on Bot Access Control / Security Events bot actions |
| SIEM mode None | “It never happened” | Console Security Events still hold past events (Help: 90 days). Fix logging separately. |
| Second hostname on the ticket | Trust primary Fully configured | Official: status is the first domain only |
- UTC window written next to the tool you opened.
- Site status quoted for the hostname on the ticket (Fully configured / Partial / Not configured / Disabled).
- One transaction quoted: Security Events Action + violation type + Incident ID, or WAF Policies mitigation + Audit Trail, or one W3C log row.
- Next tool named — or change-control owner named. No Save policy without residual control.
- Alert Only not treated as Block Request. Ignore not treated as “Imperva is off.”
- Add exception / Edit directly in policy / Release session not clicked until isolate is done.
I name the question, then the first official menu, then one field. Site status proves the website is on Imperva. Security Events proves the session. WAF Policies proves the mitigation. Action proves Block Request versus Alert Only versus Ignore. The SIEM row proves the request in W3C fields. I do not disable a WAF rule, detach the default policy, or release a session until that field is on the ticket. Factory model: a 403 can be the product succeeding.
Knowledge check
Six night-shift judgments. Each maps to a first tool or a proof field. Check answers, then Reset if you picked the wrong surface.
Sources
- Imperva Help — View Security Events (Application → Security Events; events per session; WAF Sessions; Add an exception; Edit directly in policy)
- Imperva Help — Release Blocked Sessions (Application → Security Events → WAF Sessions)
- Imperva Help — Cloud WAF Error Pages and Codes (Incident ID → filter Security Events)
- Imperva Help — Create and Manage Policies (Application → WAF > WAF Policies; default WAF Rules policy; Block Request; Sensitive Information Leakage → Ignore)
- Imperva Help — Web Protection — WAF Settings (Websites → Website Settings → WAF; Alert Only definition; most settings now on the WAF Rules policy)
- Imperva Help — Customer Setup Checklist (historical XSS → Alert Only default — confirm live mitigation)
- Imperva Help — Troubleshoot False Positives (WAF Rules policy defines the response)
- Imperva Help — Web Protection — Websites (Fully / Partially / Not configured / Disabled; first-domain DNS caveat)
- Imperva Help — Website Security Dashboard (Application → WAF > Dashboards > Security; click type → Security Events)
- Imperva Help — Website Settings (Origin Servers and sibling settings pages)
- Imperva Help — Connectivity Report (tests per origin on Websites → Settings → Origin Servers)
- Imperva Help — Cloud WAF Log Integration (Security Logs / Access Logs / None; 90-day Security Events)
- Imperva Help — Log File Structure (
cs-uri,sc-status,cs-rule, attack-type codes) - Imperva Help — Example Logs (W3C header:
cs-rule,cs-attacktype,cs-attackid,s-ruleName) - Imperva Help — Activity Log (Application → Activity Log)
- Imperva Help — Audit Trail (Account → Account Management → Audit Trail; WAF Rules Policy entries)
Related: Blog 1 · Imperva session factory · Cloud WAF DNS / SSL / origin runbook · Attack Analytics SOC triage · Advanced Bot Protection runbook · Imperva WAAP practice dashboard