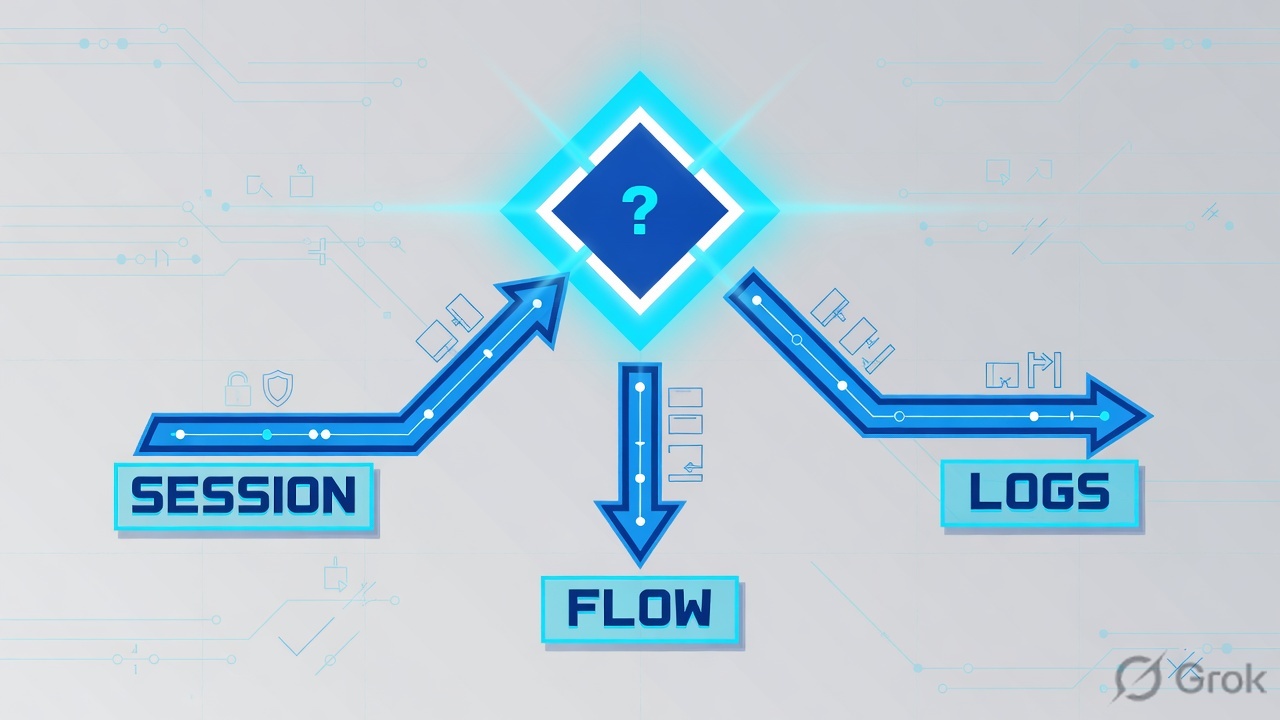
Live 5-tuple right now → session table first (filter then list; proof is proto_state + policy_id). Packet never installed a session, or you need the per-packet verdict → filtered diagnose debug flow (then stop). It already happened → Log & Report Forward Traffic; proof is action + policyid, and utmaction if UTM touched it. You change nothing until those fields are in the ticket.
Filter is not a list. proto_state 01 is not a missing allow. A traffic log action=accept is not a finished handshake. Debug flow without a filter is a change you did not get approved. Empty flow on HTTPS can be NP offload — that is official, not a broken CLI.

1. Why the desk exists
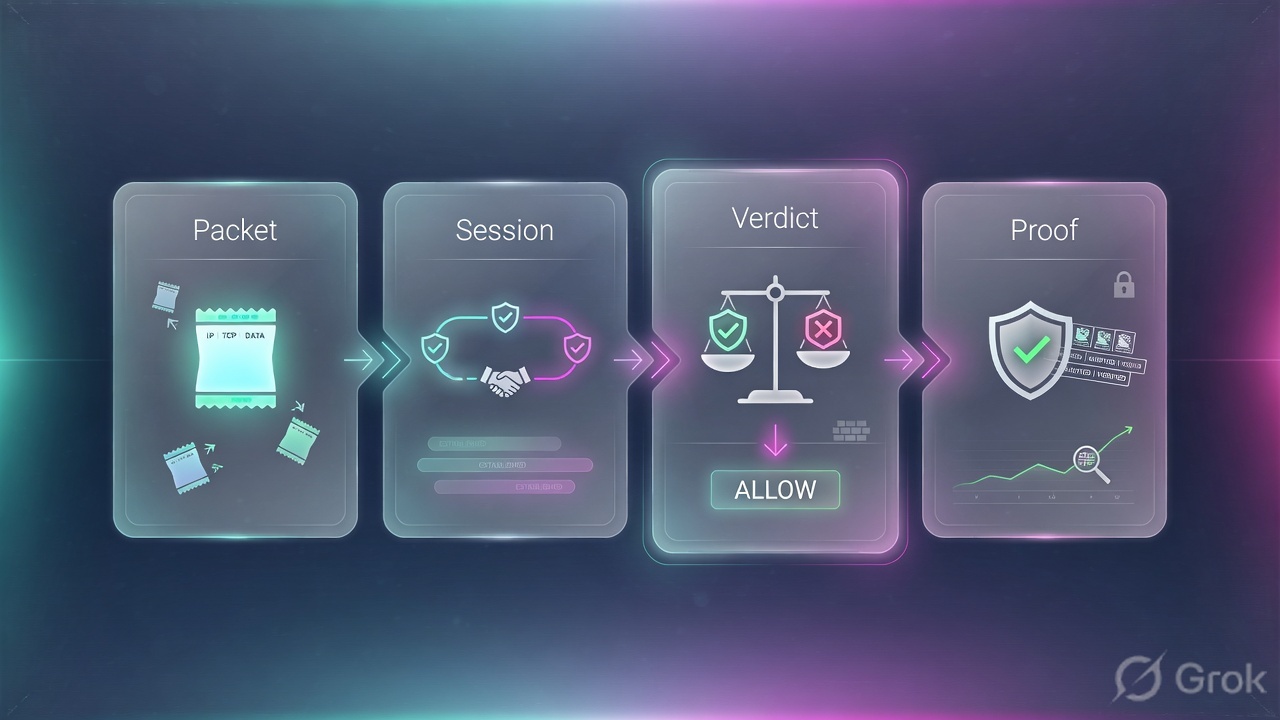
The session factory taught how FortiOS builds a flow. This page is the night shift. Five tickets. Each one has a first tool and a proof field. If you cannot name both, you are not ready to ask for a change window.
Concept: evidence is a field, not a feeling. Path: pick the instrument → filter → read one field → write the ticket sentence. Do: close all five tickets below without adding policy 15.
Fortinet documents that diagnose debug flow generates a significant amount of data. If the FortiGate is connected to FortiAnalyzer or FortiCloud, that output is recorded as event log messages. Do not run it longer than necessary. Unfiltered flow, session-table flush, and leaving debug enabled are forbidden on this desk.
2. Three instruments
Pre-train the three words before the tickets. You will use all three tonight. You will start with only one.
Session table — live now
diagnose sys session filter then list. Official filter keys include src, dst, dport, proto, proto-state, policy, vd. Proof fields: proto_state, policy_id, orig/reply tuple, NAT hooks.
Debug flow — this packet
CLI: filter, enable, trace start <N>, then trace stop. GUI: Network → Diagnostics → Debug Flow. Proof lines: received a packet, allocate a new session, Allowed by Policy-N, or no line at all.
Log & Report — already happened
GUI pane Log & Report. Forward Traffic is type=traffic subtype=forward. Proof fields from the official log reference: action, policyid, sessionid, utmaction, utmref.
They are not substitutes
A session is now. A flow trace is why this packet. A log is history. iprope lookup (predicted policy) is none of the three — do not treat it as live proof.
3. First-tool decision
Flowchart first. Read the diamond, then the prose.
Read the diamond first. Yellow is isolate but risky live. Never start there because someone is loud.
4. How to choose
| If you see | First tool | Proof field | Not first |
|---|---|---|---|
| HTTPS hangs right now; you have src/dst/port | Session table: filter then list | proto_state + policy_id | New accept policy |
| User said “blocked” 10 minutes ago; session is gone | Log & Report → Forward Traffic | action + policyid | Unfiltered session dump |
| Filter + list is empty; packet may never have arrived | Filtered debug flow | “received a packet…” vs silence | Adding policy 15 |
| Policy already accepts; page is a FortiGuard / IPS block | Log & Report (traffic + Security Events) | utmaction (and utmref) | Another accept |
| Debug flow prints nothing for live HTTPS | Session npu_state, then ICMP flow or disable NP offload | Official NP6/NP7 exception | Leaving flow on overnight |
Primary source for the session column: FortiOS Administration Guide — Using a session table. Primary source for the flow column: Debugging the packet flow plus Using the debug flow tool. Primary source for the log column: FortiOS Log Message Reference — Log message fields.
5. Side A / B / C — the three tools
Hard words, then the commands. Tickets come next. Every step cites one official page.
Side A — session table (isolate)
Source: Using a session table. FortiOS places an entry in the session table for each traffic session that passes through a security policy. The CLI supports filters so you show only the data you need.
-
State VDOM and HA role
get system statusand, if clustered,get system ha status. An empty table on the standby is not a missing policy. -
Arm the filter — this is not a list
diagnose sys session filter src 10.10.20.45. Official options also includedst,dport,proto,proto-state,policy,vd(−1 matches all VDOMs), andclear. -
List and read the proof fields
diagnose sys session list. Quoteproto_state,policy_id, orig-tuple, reply-tuple, NAT hooks. TCPproto_state=01is SYN seen — not established.11is the established pair operators look for after a fix. -
GUI twin (optional show-back)
FortiView Sessions, or Security Fabric → Physical Topology → Metrics → Sessions. Same 5-tuple. Do not open Firewall Policy from this screen to add 15.
FGT-LAB # diagnose sys session filter src 10.10.20.45
session filter:
        vd: 0
        proto: any
        src: 10.10.20.45-10.10.20.45
        dst: any
filter applied.

FGT-LAB # diagnose sys session list
session info: proto=6 proto_state=01 duration=48 expire=3552 timeout=3600
  orig-tuple: 10.10.20.45:51990 -> 198.51.100.80:443
  reply-tuple: 198.51.100.80:443 -> 203.0.113.20:18422
  hook=post dir=org act=snat 10.10.20.45:51990->203.0.113.20:18422
  policy_id=14 pol_idx=0
  npu_state=00000000
  total: 1 session listed
Proof field: proto_state=01 with policy_id=14. Filter is armed; list is a second command. Source: Using a session table — diagnose sys session filter / list.
Side B — diagnose debug flow (isolate, risky)
Source: Debugging the packet flow (CLI) and Using the debug flow tool (GUI). Packet-flow debug is a CLI-first instrument. The GUI path is Network → Diagnostics → Debug Flow.
-
Filter first — official keys
IPv4:
diagnose debug flow filterwithaddr,saddr,daddr,port,sport,dport,proto,vd, orclear. IPv6 usesfilter6. GUI Basic filter = addr / port / proto. GUI Advanced = saddr / sport / daddr / dport / proto. -
Enable, name functions, start N packets
Official sequence:
diagnose debug enable→diagnose debug flow filter addr 10.10.20.45→diagnose debug flow show function-name enable→diagnose debug flow trace start 100. GUI: click Start debug flow. Messages are real-time. -
Read the official-style lines
Look for
received a packet,allocate a new session,find a route,Allowed by Policy-N: SNAT. Silence after a reproduce is also evidence — the packet never hit this VDOM, or the session is NP-offloaded. -
Stop is part of isolate
diagnose debug flow trace stop, then disable / reset. GUI: Stop debug flow, then Save as CSV if you need the file. Add the Function column (Configure Table) when you wantfw_forward_handlernext to the message.
FGT-LAB # diagnose debug enable
FGT-LAB # diagnose debug flow filter addr 10.10.20.45
FGT-LAB # diagnose debug flow show function-name enable
FGT-LAB # diagnose debug flow trace start 100
id=20085 trace_id=17 func=print_pkt_detail msg="vd-root:0 received a packet(proto=6, 10.10.20.45:51990->198.51.100.80:443) from port2."
id=20085 trace_id=17 func=resolve_ip_tuple msg="allocate a new session-00000e90"
id=20085 trace_id=17 func=fw_forward_handler msg="Allowed by Policy-14: SNAT"
FGT-LAB # diagnose debug flow trace stop
FGT-LAB # diagnose debug disable
FGT-LAB # diagnose debug reset
Proof field: the Allowed by Policy-14: SNAT line (official sample style: Allowed by Policy-3: SNAT). Stop and reset are mandatory. Source: Debugging the packet flow.
Network → Diagnostics → Debug Flow · VDOM root
Debug Flow
FortiOS Administration Guide · Using the debug flow tool. Path: Network → Diagnostics → Debug Flow. Advanced fields map 1:1 to saddr / sport / daddr / dport / proto. Next click after the reproduce: Stop debug flow, then Save as CSV.
Flow monitoring does not work for traffic offloaded to NP6 or NP7 processors. Official workarounds: test with ICMP (ICMP is not offloaded) or temporarily disable NP offloading. Do not treat a blank HTTPS trace as “the packet never arrived” until you have checked npu_state on the session.
Side C — Log & Report (history)
Source: Log message fields. In the GUI you view logs in the Log & Report pane (formatted). Raw format is a download you open in a text editor. A traffic log is type="traffic" subtype="forward".
-
Open Forward Traffic, filter the 5-tuple
Log & Report → Forward Traffic. Filter source
10.10.20.45, destination, service HTTPS. You are looking for a row that already exists — not a live session. -
Quote the official fields
action(example in the reference:close; you will also see accept / deny / ip-conn).policyid.sessionid.trandisp/transipif NAT.utmactionis “Security action performed by UTM.”utmrefis the UTM reference number — follow it into Security Events. -
If utmaction is not allow, open Security Events
Web Filter, IPS, Antivirus — whichever profile the policy attached. The traffic log can say the firewall accepted while UTM blocked. That is not a missing accept rule.
Log & Report → Forward Traffic · VDOM root · formatted view
Forward Traffic
FortiOS Log Message Reference · Log message fields. Formatted view lives in Log & Report. Raw is a download. Proof on this row: action=deny and policyid=0 (implicit). Next click: do not add policy 15 until you know which interface pair missed a policy.
6. Five tickets
Each card is the same contract: first tool, proof field, ticket sentence, what you do not do. Lab 5-tuple: 10.10.20.45 → 198.51.100.80:443, SNAT 203.0.113.20.
Five tickets. Five first tools. Five fields. If you cannot point at this row, keep isolating.
T1 — HTTPS allowed, handshake never finishes
Browser stays on connecting to 198.51.100.80:443. Helpdesk wants a new accept. Lab user 10.10.20.45.
filter src then listproto_state=01 with policy_id=14Hypothesis: policy already accepts. TCP is not established. The Side A CLI card is this ticket. SNAT hook is present. Reply tuple exists. Handshake is one-way.
Ticket sentence: Policy 14 already matched. proto_state=01 — SYN seen, not established. Adding policy 15 will not finish TCP. Isolate the return path / server SYN-ACK. Change-control only with an owner if the SNAT pool or return route is wrong.
T2 — “It was blocked ten minutes ago”
User on a new subnet tried once and gave up. Live session list for that src is empty. NOC wants you to “just add the same policy again.”
action=deny + policyid=0History, not live. The Side C portal is this ticket. Official fields: type=traffic subtype=forward, action, policyid, srcip, dstip, srcintf, dstintf.
Ticket sentence: Forward Traffic shows action=deny policyid=0 for this 5-tuple — implicit deny, not a broken session. Next isolate is the interface pair on that log row. Change-control is one new policy on the right srcintf/dstintf, not a clone of 14 on the old pair.
T3 — Filter + list is empty, user is clicking now
Session filter for 10.10.20.88 lists nothing. User is reproducing. You do not know if the packet reached this FortiGate.
diagnose debug flow (then stop)received a packet… from <intf> — or silenceUse Side B. Confirm you are on the HA primary and the correct VDOM first. Then filter addr 10.10.20.88, trace start 100, reproduce, read, stop.
If you get vd-root received a packet … from port2 and then a deny or no route — the packet arrived; the verdict is on the next line. If you get nothing, the packet never hit this VDOM (wrong box, wrong VLAN, or you are on standby). That silence is the proof. Do not add a policy for a packet that never arrived.
T4 — Policy accept, page is a FortiGuard block
Session shows policy_id=14 and proto_state=11. User still sees a FortiGuard replacement page. Someone already asked to “open 443.”
utmrefutmaction (official: “Security action performed by UTM”)Established TCP plus a block page is UTM, not a missing accept. Official traffic-log example includes utmaction="allow" and utmref=0-220586. Your row will show a non-allow UTM action and a utmref you follow.
Ticket sentence: Firewall accepted (policyid=14, session established). utmaction is the block. Change-control is the Web Filter / IPS profile or an override — not policy 15.
T5 — Debug flow is empty on production HTTPS
Hardware FortiGate. Session exists, users work or fail, but diagnose debug flow prints nothing for that HTTPS 5-tuple. Junior engineer wants to leave flow on until morning.
npu_state, then ICMP flow or disable NP offloadnpu_stateFortinet: flow monitoring does not work for traffic offloaded to NP6 or NP7. Official options: test with ICMP (not offloaded), or temporarily disable NP6 fastpath / disable NP7 offloading on the firewall policy that accepts the traffic.
Ticket sentence: Empty HTTPS flow is not proof the packet missed the box. Session npu_state shows offload. Retest ICMP with a tight filter, or an approved offload disable, then stop debug. Leaving flow on is forbidden.
7. After the capture
Once the first tool has spoken, the runtime path is short. You do not start a second dangerous tool because you are curious.
-
Paste the field
One line in the ticket: instrument + field + 5-tuple + VDOM + HA role.
-
Turn dangerous things off
diagnose debug flow trace stop→ disable → reset. GUI: Stop debug flow. Confirm no leftover filter if you will hand the box to day shift (diagnose sys session filter clearis a filter clear — not a session flush). -
Decide isolate vs change-control
A read is isolate. A new policy, NAT pool, profile change, or NP disable on a production policy is change-control: one owner, one reversible edit, same 5-tuple retest.
-
Retest the same tuple
Success is
proto_state=11(or the user transaction) plus, if UTM was in play,utmaction=allow. Green HA and a green dashboard widget are not the retest.

8. Traps and proof
| Trap | You will hear | You write instead |
|---|---|---|
| List without filter | “Just dump sessions” | Filter src, then list. Official CLI is filter + list. |
| Accept = healthy | “Add policy 15” | T1: policy_id=14 + proto_state=01 |
| Empty table = no policy | “Nothing is matching” | Wrong VDOM / standby, or T3 — run filtered flow |
| Empty flow = never arrived | “Packet never hit us” | T5: check npu_state and the NP6/NP7 exception first |
| Traffic accept = page works | “Firewall allowed it” | T4: read utmaction / utmref |
| Debug forever | “Leave flow on so we catch it” | Filter, trace start N, stop, disable, reset |
| Filter clear = session clear | “Clear the filter to drop the hang” | filter clear clears the view. Session clear is a user-impacting change. |
- VDOM + HA role named (primary vs standby).
- First tool named: session / debug flow / Log & Report.
- One proof field:
proto_state, flow line, oraction+policyid/utmaction. - Debug flow: filter applied,
trace start N, then stop + disable + reset (or GUI Stop). - If flow was empty on HTTPS:
npu_statechecked; ICMP or approved NP disable used. - After a change: same 5-tuple retest. Established =
proto_state=11(andutmaction=allowif UTM was the fault).
I pick the instrument from the symptom: live tuple → session table, this-packet verdict → filtered debug flow, already happened → Log & Report. I quote proto_state, the flow Policy-N line, or action/policyid/utmaction. I do not add accept rules to fix a one-way handshake or a UTM block. I stop debug. Empty HTTPS flow makes me say NP offload out loud.
Knowledge check
Six judgments. Each maps to a first tool or a proof field. Check answers. Reset and retry if you miss isolate versus change.
Sources
- FortiOS Administration Guide 8.0.0 — Debugging the packet flow (CLI filter keys,
trace start/stop, FAZ/FortiCloud warning, NP6/NP7 exception, sample “Allowed by Policy-3: SNAT”) - FortiOS Administration Guide 8.0.0 — Using the debug flow tool (Network → Diagnostics → Debug Flow; Basic/Advanced filters; Start / Stop / Save as CSV; Function column)
- FortiOS Administration Guide 7.4.0 — Using a session table (
diagnose sys session list/filteroptions includingproto-state,policy,vd; Physical Topology → Sessions) - FortiOS Administration Guide — FortiView Sessions
- FortiOS Log Message Reference 8.0.0 — Log message fields (Log & Report formatted view;
type=traffic subtype=forward;action,policyid,utmaction,utmref) - FortiOS CLI Reference — diagnose sys (session filter / proto-state)
Related: FortiGate session factory · FortiGate troubleshooting command center · FortiGate interview · Policies and NAT · FortiGate interview hub