Device / Cyber AI Analyst answers “does Threat Visualizer even have this host, and did AI Analyst write an incident?” Model Breach answers “which DETECT model fired, at what score, in what status?” Antigena action answers “did RESPOND act, or only would-have?” Probe / vSensor health answers “is the sensor that should see this VLAN up?” Traffic coverage answers “did packets land in the Device Event Log?” A high score is not a block. An empty Threat Tray is not “Darktrace is fine.” You cannot score what the SPAN never sent.
1. Why “is Darktrace seeing this?” is five questions
Operators collapse five failures into one sentence. The host was never modeled. DETECT never breached because the behaviour was not unusual — or because the packets never arrived. Antigena is on Human Confirmation, so nothing was blocked. The vSensor is disconnected after a vMotion. The SPAN was moved off the core and the Device Event Log went quiet. Those are five first clicks.
This page is the night-shift desk for proof. The factory taught score ≠ malware, peer group, and Antigena off will not block. Here you learn the five Threat Visualizer surfaces you actually open, in order, when someone asks you to prove Darktrace is seeing a host — or to explain why there is no model breach.
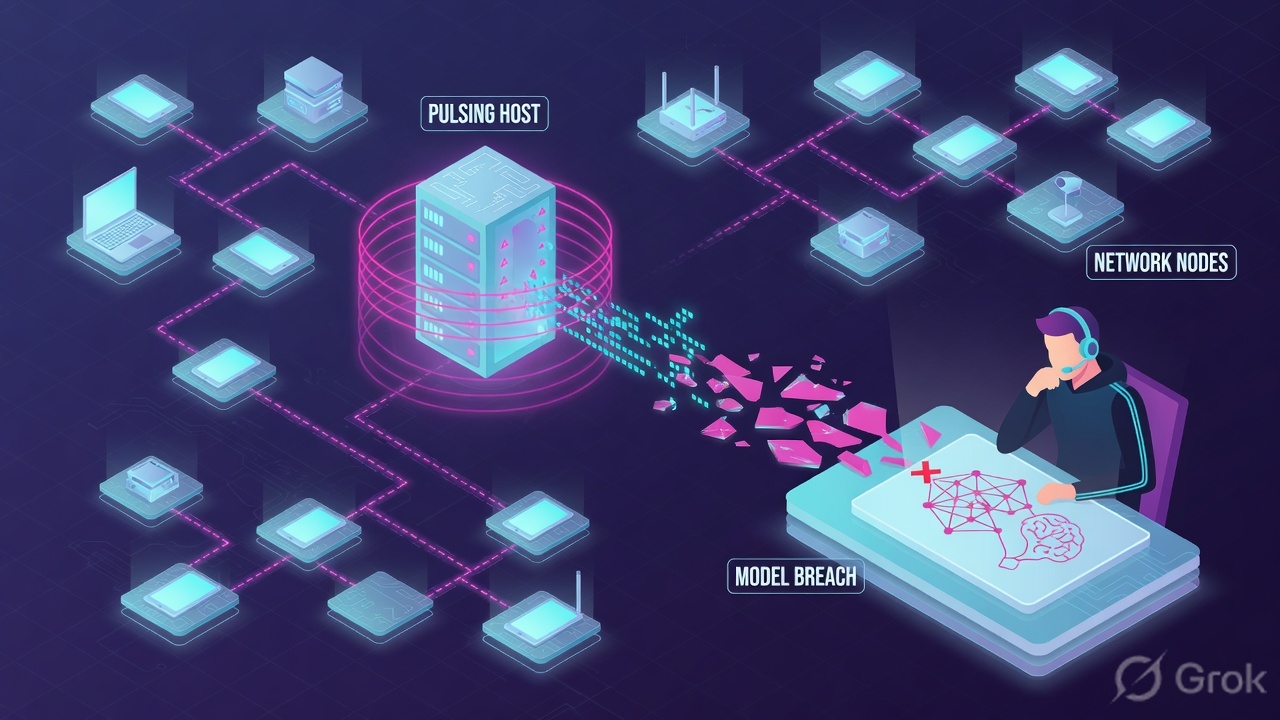
If they say “prove Darktrace is working,” do not say “I opened Threat Visualizer.” Say: “I prove the host with Device Summary First Seen / Last Seen, the DETECT story with the Model Breach name and score, the block with Antigena last action / would-have, the sensor with Probe / vSensor status, and the wire with Device Event Log connections in the ticket window.”
2. Mental model — five proof tools
Memorise five named objects before you click. Each tool is allowed to prove one thing. Over-claiming a field is how you disable a model or flip Antigena Active at 02:00 for a host the SPAN never saw.
1 · Device / AI Analyst
Threat Visualizer → search hostname / IP → Device Summary. Proves the host exists: First Seen, Last Seen, OS, subnet, tags. Cyber AI Analyst is the written incident — a lead, not a conviction.
2 · Model Breach
Threat Visualizer → Model Breaches (Threat Tray) → Model Breach Event Log. Proves one DETECT object: model name, score / priority, time, acknowledged or not. Does not prove a block.
3 · Antigena action
Device Summary → Antigena, or System Config → Antigena / Autonomous Response. Proves RESPOND: Human Confirmation (Passive) vs Fully Autonomous (Active), last action, would-have. DETECT is not RESPOND.
4 · Probe / vSensor
System Config → Probes (physical probe, vSensor, osSensor). Proves the appliance that should see this VLAN is connected to the master and ingesting. A green TV homepage is not probe health.
5 · Traffic coverage
Device → Device Event Log (connections in the UTC window) plus probe packets/s. Proves packets landed. Empty Event Log on a busy subnet is a SPAN / TAP ticket, not a Model Editor ticket.
Hard words, once
Model breach = DETECT alert object. Enhanced Monitoring = higher-fidelity models, still not malware. Would-have = what Antigena would do in Active. Acknowledge assigns an owner — it does not contain the host. vSensor needs a working SPAN or osSensor feed.
Read left → right. Each box is allowed one claim. If you cannot name the field, you are not proving — you are guessing.
I prove the host, then the model breach, then Antigena state, then the probe, then the Event Log. I do not exception a model, isolate a VLAN, or flip Antigena Active until I can quote the field that made me do it.
3. Decision flow — ticket → first tool
Flowchart first. Do not open Model Editor until a diamond says so.
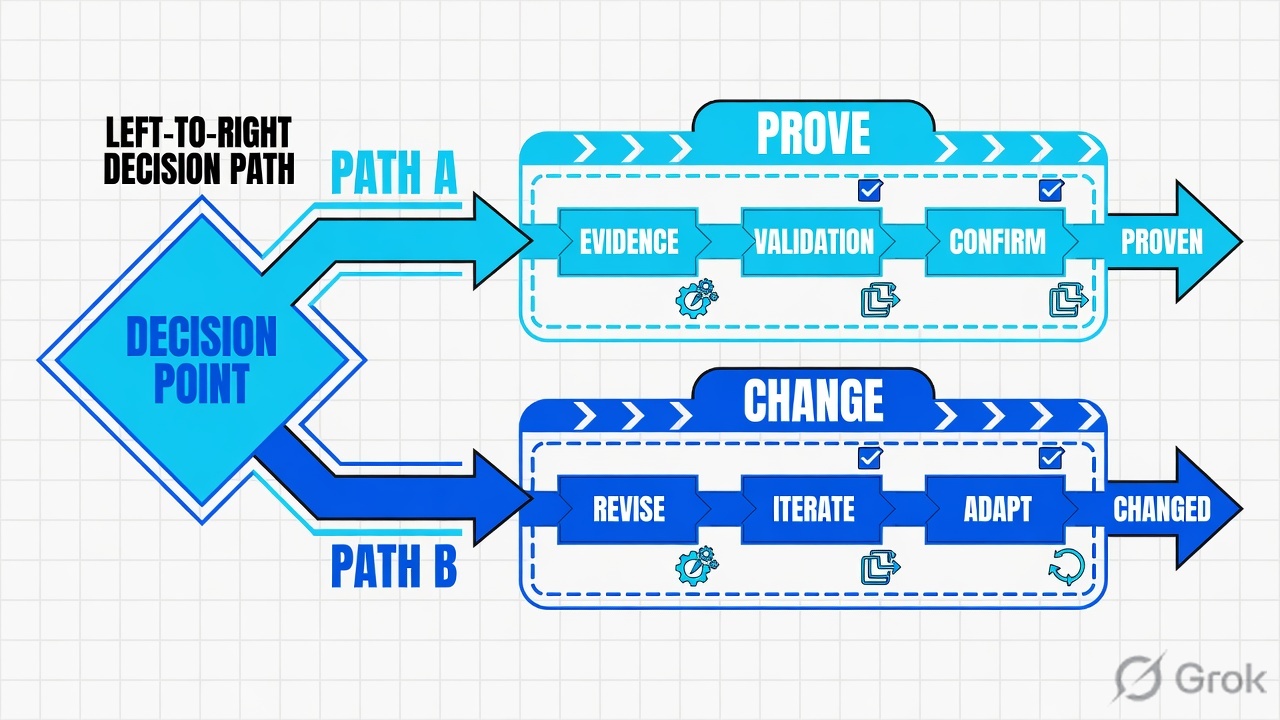
Read the diamond first. “Why no block?” never starts in Model Editor. “VLAN quiet” never starts with Antigena Active. “Device not found” never starts in the Threat Tray.
4. How to choose — first tool + proof field
Print this next to Threat Visualizer. If you cannot recite the proof field, you are not ready to change anything.
| If the ticket says… | First tool (official path) | Proof field | Do not open first |
|---|---|---|---|
| “Is Darktrace even seeing this host?” | Threat Visualizer → search hostname / IP → Device Summary (then Cyber AI Analyst if an incident exists) | First Seen + Last Seen — or “device not found” |
Model Editor / a global exception |
| “Why no model breach?” after an incident they described | Threat Visualizer → Model Breaches (Threat Tray) filtered to that device + UTC window | Empty tray + Device Event Log rows (or no rows) in the same minute | Antigena Active / isolate the subnet |
| “Why didn’t Darktrace block?” / score is already high | Device Summary → Antigena, or System Config → Antigena / Autonomous Response | Deployment mode (Human Confirmation / Passive vs Fully Autonomous / Active) + last action + would-have |
VirusTotal / disable the model |
| Whole VLAN quiet after a core / vMotion / TAP change | System Config → Probes (physical probe, vSensor, osSensor) | Probe status + connected-to-master + SPAN / capture state | A new Enhanced Monitoring model |
| Host exists; models look thin; “coverage?” | Device → Device Event Log for the ticket UTC window | Connections present (dest / proto / time) or empty log + collapsed packets/s | A 02:00 Antigena flip |
Darktrace / NETWORK models connections even when the payload is encrypted — destination, volume, timing, and peers still update pattern of life. An empty Device Event Log is not “TLS so Darktrace is blind.” Empty log on a busy subnet is a SPAN / vSensor / mirror miss. Confirm probe health, then the Event Log, then talk about models.
5. Runbook Side A → B → C
Side A proves the host and the DETECT object. Side B proves RESPOND. Side C proves the sensor and the wire. On a messy Sev-2, do them in this order until a field lights up.
Side A — Device, Cyber AI Analyst, Model Breach (DETECT)
-
Search the host before you argue the score
Threat Visualizer search: hostname, IP, or MAC. Open Device Summary. Official Threat Visualizer language (Customer Portal user guide):
First Seen,Last Seen, Operating System, subnet. If search returns nothing, stop. There is no model breach to chase. Source: Darktrace Customer Portal — Threat Visualizer User Guide (Device Summary). -
Read Cyber AI Analyst as a lead, not a close
Path: Threat Visualizer → Cyber AI Analyst. Official product: Cyber AI Analyst autonomously investigates relevant model alerts and writes an incident narrative. Quote the incident title and the related model breaches. It is not a malware family name and it is not containment. Source: darktrace.com/cyber-ai-analyst.
-
Open the Model Breach, not Slack
Path: Threat Visualizer → Model Breaches (Threat Tray). Open the breach → Model Breach Event Log. Quote the full model name (Darktrace publishes names like
Compromise / Ransomware / Suspicious SMB Activity,Device / Reverse DNS Sweep,Compromise / Beaconing Activity To External Rare), the score / priority, the timestamp, and acknowledged vs unacknowledged. Source: Darktrace DETECT blogs + Threat Visualizer User Guide. -
If the tray is empty for that host and window, switch surfaces
Do not invent a missed ransomware model. Open Device Event Log for the same UTC window. Rows present + no breach can mean the behaviour was not unusual, a model is excepted, or Enhanced Monitoring is off. No rows means coverage — jump to Side C. Do not open Model Editor from an empty log.
Threat Visualizer / Devices / finance-lap · 10.10.8.22
Device Summary
No device matching 10.80.4.17
→ stop. Quote “device not found.” Do not hunt a model breach.
Source: Darktrace Customer Portal — Threat Visualizer User Guide (Device Summary: First Seen, Last Seen, Operating System). Cyber AI Analyst incident is a lead. Lab identities only. Training mock · not live.
Threat Visualizer / Model Breaches / MB-1042
Model Breach Event Log
| Time (UTC) | Model | Score | Status | Antigena |
|---|---|---|---|---|
| 01:12:08 | Device / Reverse DNS Sweep | 41 | Ack | None |
| 01:38:44 | Compromise / RDP / Unusual External Destination | 82 | Unack | Would-have |
Source: Darktrace Customer Portal — Threat Visualizer User Guide (Model Breaches, Model Breach Event Log). Model name style as published on darktrace.com blogs (Category / Behaviour). Lab values only.
Side B — Antigena action (RESPOND)
-
Quote the mode before anyone asks “why”
Device Summary shows Antigena state for that host / group. Estate-wide switch lives at System Config → Antigena (Autonomous Response / Antigena Network). Official modes in Darktrace RESPOND language: Human Confirmation (Passive) versus Fully Autonomous (Active). Passive will not block. Source: Darktrace RESPOND / Antigena product pages + Customer Portal System Config.
-
Read last action, then would-have
Published Antigena model names look like
Antigena / Network / Manual / Quarantine DeviceandAntigena / Network / Significant Anomaly / Antigena Enhanced Monitoring from Server Block. If last action is none and mode is Human Confirmation, the proof field is would-have — for example “enforce pattern of life / block RDP to 203.0.113.88.” That sentence is what you tell the CISO. Source: Darktrace incident blogs (Sodinokibi, WastedLocker, WSUS CVE write-ups). -
Isolate now; Active later
Blocking this connection (firewall, NAC, EDR, or a targeted Antigena action if you already have Active on that model) is incident response. Flipping the group to Fully Autonomous is change-control. Do not mix them on the same 02:00 ticket. Official Active-mode story: RESPOND can stop never-before-seen ransomware with no public IOC — only when it is actually on. Source: darktrace.com — How RESPOND Neutralizes Zero-Day Ransomware.
Path:            System Config → Antigena / Autonomous Response
                 or Device Summary → Antigena
Device:          10.10.8.22 · VLAN20 Finance
Mode:            Human Confirmation / Passive
Last action:     none
Would-have:      Block RDP to 203.0.113.88
Quote:           mode + last action + would-have
Do not:          flip Fully Autonomous from the P1 chat
Side C — Probe / vSensor health + traffic coverage
-
Open Probes, not Model Editor
Path: System Config → Probes (some builds: Admin → System Config). Official objects: physical probe, vSensor (virtual probe on a SPAN from the virtual switch), osSensor when you cannot SPAN. Darktrace’s vSensor deployment notes put probe tokens under System Config (Push Probe Tokens). Quote connected / disconnected and which master the probe reports to. Source: Darktrace vSensor announcement + Customer Portal System Config.
-
Then prove packets in Device Event Log
Select the device → Device Event Log. Official TV workflow: when a device is selected, open its event log to review connections over time. Filter the ticket UTC window. Quote dest / proto / first-seen of the new peer — or quote “no connections in window.” Source: Threat Visualizer User Guide (Device Event Log).
-
Quiet PPS on a busy VLAN is a coverage incident
A connected vSensor with collapsed packets/s after a core change is almost always the SPAN / TAP / ERSPAN moved off the monitor session. Open a coverage ticket with network. Do not write a model exception for traffic you never captured. Darktrace is explicit: you cannot detect what is not on the wire.
System Config / Probes / SENSOR-LAB-17
vSensor · SENSOR-LAB-17
01:05Z core change · monitor session removed
01:08Z pps=40 · Device Event Log on VLAN20 empty
Source: Darktrace Customer Portal — System Config (Probes, Push Probe Tokens). vSensor as official virtual probe that receives a SPAN. Lab labels only. Training mock · not live.
- Side A host: Device Summary returns the IP with
First Seen/Last Seenin the ticket window. Side A DETECT: Model Breach Event Log names the model + score + unacknowledged/acknowledged. - Side B: Antigena mode quoted; last action or would-have pasted; Active change is a separate ticket.
- Side C: Probe status + SPAN/capture; Device Event Log either shows the new peer or proves the log is empty.
6. Five tickets as full stories
These five land every quarter. Memorise first tool + proof field. Times and identities below are lab-only (RFC 5737 / RFC 1918).
| Ticket | Symptom | First tool | Proof field |
|---|---|---|---|
| DTEVD-01 | “Is Darktrace even seeing this host?” | Device Summary | First Seen / Last Seen — or device not found |
| DTEVD-02 | Incident described; “why no model breach?” | Model Breaches + Event Log | Empty tray + connections present or absent in the same minute |
| DTEVD-03 | Score 82; “why didn’t it block?” | Antigena / Autonomous Response | Mode + last action + would-have |
| DTEVD-04 | After a core / vMotion change, models went quiet | System Config → Probes | vSensor status + SPAN / capture |
| DTEVD-05 | Host exists; whole VLAN “Darktrace is blind” | Device Event Log | No connections in window + collapsed PPS |
DTEVD-01 — Prove the host (Device / Cyber AI Analyst)
01:42 · P2. IR Slack: new finance contractor laptop 10.80.4.17. “Darktrace should have seen the phishing click.” L1 already drafted a model exception for email.
First tool: Threat Visualizer search → Device Summary.
If device not found: quote that sentence. Next check is coverage — is this subnet on a SPAN / vSensor / osSensor, is the laptop on VPN off-net, is DHCP in a range Darktrace never modeled? There is no Model Breach Event Log to open.
If the host exists: quote First Seen and Last Seen. A host First Seen at 01:40 with no history will score almost everything tomorrow — that is a new-device baseline, not ransomware. Then open Cyber AI Analyst: if no incident exists, say so. AI Analyst is allowed to be empty when DETECT never investigated.
Do not trust a colleague’s Device Summary from yesterday. The proof is this hostname / IP, this UTC window. A phone photo of the Threat Visualizer homepage is not Last Seen.
DTEVD-02 — Prove the missing breach (Model Breaches)
02:05 · P2. SOC: “EDR says Word spawned an unusual child. Why no Darktrace model breach?” Device Summary already shows Last Seen 02:04Z.
First tool: Model Breaches filtered to that device + last hour. Then Device Event Log for the same minute.
Proof field: empty Threat Tray plus Event Log rows to an internal file share only — pattern of life was not unusual, so DETECT correctly did not breach. Or: Event Log empty — you never had the packets, so “no model breach” is a coverage finding (DTEVD-05), not a DETECT miss. Or: a model is excepted in Model Editor for that tag — quote the exception owner and expiry.
I would not add a new Enhanced Monitoring model at 02:00. I would quote empty tray + Event Log contents. If connections exist and look like the EDR story, I read peer group and existing models. If the log is empty, I leave DETECT alone and open Side C.
DTEVD-03 — Prove the block decision (Antigena action)
02:20 · P1. MB-1042: Compromise / RDP / Unusual External Destination, score 82, dest 203.0.113.88. Leadership: “we paid for AI — why was it allowed?”
First tool: Device Summary → Antigena, then System Config → Antigena / Autonomous Response for VLAN20.
Proof field: Deployment mode = Human Confirmation / Passive. Last action = none. Would-have = block RDP to 203.0.113.88 (or Antigena Quarantine Device if that model is in the pack). DETECT fired. RESPOND was not allowed to act. Isolate the RDP now (firewall / NAC / EDR). Active is change-control with owner, model list, and rollback.
I would not answer “Darktrace failed.” I would paste mode + would-have. Official Darktrace ransomware cases needed Antigena in Active Mode to stop encryption in seconds. Passive is the product working as licensed.
DTEVD-04 — Prove the sensor (Probe / vSensor health)
02:40 · P1. After a 02:00 VMware / core change, VLAN20 models went quiet. Someone wants every threshold lowered.
First tool: System Config → Probes → the vSensor that owns that SPAN (SENSOR-LAB-17).
Proof field: status still “connected” but SPAN / capture degraded and packets/s collapsed at 02:01. That is a monitor-session / promiscuous-port / ERSPAN ticket for network, not a Model Editor ticket. If the vSensor is disconnected from the master, quote disconnected + last check-in. Push Probe Tokens only after you know the appliance is the one that should see this VLAN.
A connected probe is not a healthy SPAN. Sample the Event Log on two other VLAN20 hosts. If all three went silent at 02:01, you have a tap outage. Tuning models in the dark hides the next ransomware wave.
DTEVD-05 — Prove the wire (traffic coverage)
03:00 · P2. Host exists. Antigena is Active on the group. Still “Darktrace saw nothing” during a confirmed SMB encrypt on another tool.
First tool: that device → Device Event Log for 02:50–03:05Z, then the vSensor PPS chart.
Proof field: no SMB connections in the Event Log and PPS near zero. Coverage — the SPAN does not include that VLAN, or east-west never hits the tap, or the host is on Wi-Fi that bypasses the monitored switch. Encrypted SMB still leaves a connection row. No row means no packets. Restore the mirror, then re-read Event Log before you talk about missed Compromise / Ransomware / Suspicious SMB Activity.
I would leave Model Editor and Antigena alone. I would paste “Event Log empty + PPS collapsed” and name the network owner. After SPAN returns, I re-check First/Last Seen and wait for the next connection row — that is the coverage close.
7. Traps + close-the-ticket proof
| You see | Weak close | Strong close |
|---|---|---|
| Device not found | “Darktrace is down” / new model | Quote search miss; fix SPAN / subnet / osSensor; re-search Device Summary |
| First Seen tonight, high scores | “Confirmed ransomware” | New baseline. Quote First Seen. Hunt peers. Do not disable models. |
| Empty Threat Tray | “DETECT failed” | Event Log in the same minute. Rows = not unusual or excepted. No rows = coverage. |
| Cyber AI Analyst narrative | Close as that family name | Lead only. Quote related model + device + Antigena state. |
| Score 82, Antigena Passive | “Darktrace allowed it” | Mode + last action none + would-have. Isolate now. Active = change-control. |
| Acknowledge clicked | “Ticket done” | Ack needs owner. Containment is a different action. |
| vSensor connected | “Sensor is fine” | SPAN / capture + PPS + Event Log on two peers. |
| Encrypted traffic | “Darktrace cannot see it” | Connections still model. Empty log is a tap miss, not TLS. |
| Tiny peer group (CEO + lab VMs) | Disable the model | Fix tags / Device Groups. Re-read the same breach. |
- UTC window written next to the tool you opened.
- Host proved on Device Summary (
First Seen/Last Seen) when the ticket is “is Darktrace seeing this?” - One DETECT object quoted: model name + score + status — or an explicit empty tray plus Event Log.
- Antigena mode + last action / would-have pasted whenever someone said “why didn’t it block?”
- Probe / vSensor status + SPAN/capture if models look thin after an infra change.
- Device Event Log named as coverage proof — empty log is not a Model Editor task.
- Next tool named — or change-control owner named. No Fully Autonomous flip without residual control.
- Peer or second host compared when you claim “not a tenant outage.”
I name the question, then the first tool, then one official field. Device Summary proves the host. Model Breach Event Log proves DETECT. Antigena last action / would-have proves RESPOND. System Config Probes proves the sensor. Device Event Log proves the wire. I do not exception a model, isolate a VLAN, or flip Antigena Active until that field is on the ticket. Factory model: score is anomaly, not malware proof.
Knowledge check
Six night-shift judgments. Each maps to a first tool or a proof field. Check answers, then Reset if you picked the wrong surface.
Sources
- Darktrace Customer Portal — official home for Threat Visualizer User Guide, Model Editor, System Config (Probes, Antigena, Push Probe Tokens). Confirm live menu labels on your appliance / cloud version before you click in production.
- Darktrace / NETWORK — Self-Learning AI, Cyber AI Analyst, autonomous response, Model Breach Event Log as a product surface.
- Darktrace — Cyber AI Analyst — autonomous investigation of model alerts; incidents are leads, not malware convictions.
- Darktrace threat detection glossary — behavioural detection vs signatures; unusual activity on a device.
- How RESPOND (formerly Antigena) Neutralizes Zero-Day Ransomware — Active Mode, published model names (
Compromise / Ransomware / Suspicious SMB Activity,Device / Reverse DNS Sweep), no public IOC required. - How AI Stopped a WastedLocker Intrusion — Threat Visualizer, Antigena in fully autonomous mode,
Device / Large Number of Model Breaches. - Cyber AI Analyst investigates Sodinokibi / REvil — related model breaches and
Antigena / Network / Manual / Quarantine Device. - Darktrace analysis of WSUS post-exploitation (CVE-2025-59287) —
Antigena / Network / Significant Anomaly / Antigena Enhanced Monitoring from Server Block. - Using Darktrace for Threat Hunting — packet captures, surrounding traffic, visualisation beyond the headline score.
- Darktrace vSensors — virtual probe configured to receive a SPAN from the virtual switch; sends to the master appliance.
Related: Blog 1 · Darktrace session factory · Darktrace interview hub · Dummy lab · Models & breaches · Autonomous response
Lab identities and RFC 5737 addresses only. Confirm Threat Visualizer paths on the production release via customerportal.darktrace.com. Dummy lab data is not a live tenant.