Security Events answers “did a security product act — and which rule?” Trace answers “what would this simulated request match?” Analytics HTTP Traffic answers “is the zone even seeing requests?” Log Explorer / Logpush answers “what exactly happened for this Ray ID?” SSL/TLS Edge Certificates answers “is the edge presenting a valid cert?” A Managed Challenge is not a block. Empty Sampled logs is not “Cloudflare is down.” Trace is not production traffic.
1. Why “is it working?” is five questions
Concept: Operators collapse five failures into one sentence. The hostname never reached the edge. A custom rule challenged /login. The rule you shipped never evaluated. Sampled logs hid the Ray ID. The Universal SSL certificate is still Pending Validation. Those are five first clicks.
This page is the night-shift desk for proof. The factory taught the exchange: a Ray ID is the ticket, WAF is not Bot, 526 is origin TLS, HIT is cache. Here you learn the five official dashboards you actually open, in order, when someone asks you to prove Cloudflare is working.

If they say “prove Cloudflare is working,” do not say “I opened the dashboard.” Say: “I prove the verdict with Security Events Action + Rule, the what-if with Trace, the wire with HTTP Traffic Requests, the forensic row with Log Explorer RayID, and the padlock with Edge Certificates Status.”
2. Mental model — five proof tools
Path: Memorise five named objects before you click. Each tool is allowed to prove one thing. Over-claiming a field is how you skip a managed ruleset at 02:00.
1 · Security Events
Zone Analytics → Events tab (deeplink /security/analytics). Proves one mitigated or flagged request: Action + Service + Rule. Does not prove un-actioned traffic or a simulated match.
2 · Trace
Account Trace (/trace). Simulates an HTTP/S request. Proves which active rules would evaluate and execute. Does not prove what production just did.
3 · HTTP Traffic
Zone Analytics & Logs → HTTP Traffic. Proves whether the edge saw Requests, plus Edge status code / Origin status code. A zero-request window is not a WAF skip.
4 · Log Explorer / Logpush
Account Log Explorer → Log Search, or zone Analytics & Logs → Logs (Logpush). Proves the forensic row: RayID, Action, RuleID, Source. Sampled logs are not this store.
5 · Edge Certificates
Zone SSL/TLS → Edge Certificates. Proves the cert the visitor sees: Type + Status (Active vs Pending Validation). Does not prove origin TLS. 526 is Full (strict) at the origin, not this page.
Hard words, once
Ray ID = cf-ray on the request. Security Events = actioned/flagged only. Security Analytics = all HTTP. firewall_events = Logpush dataset for Action + RuleID. Trace = what-if. Official docs still say Firewall events for the log dataset.
Read left → right. Each box is allowed one claim. If you cannot name the field, you are not proving — you are guessing.
I prove the verdict, then the what-if, then the wire, then the forensic row, then the padlock. I do not skip a managed ruleset, purge the zone, or pause Cloudflare until I can quote the field that made me do it.
3. Decision flow — ticket → first tool
Flowchart first. Do not open the custom-rule editor until a diamond says so.
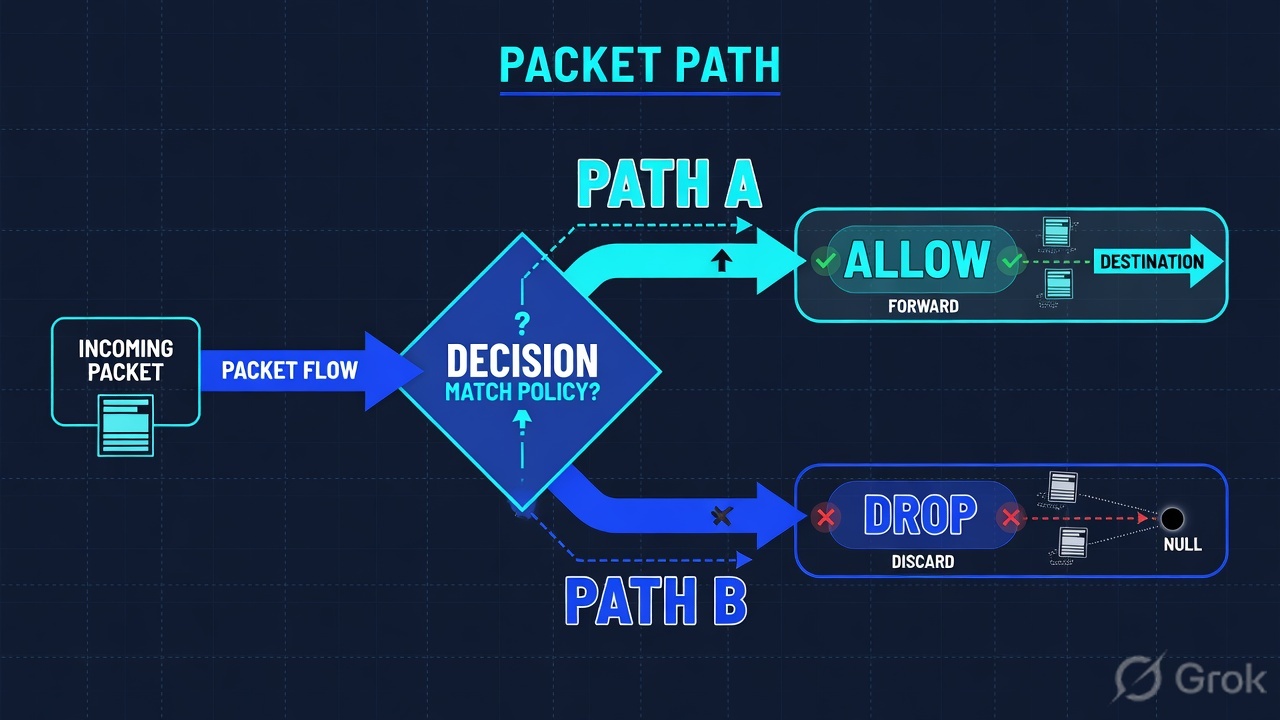
Read the diamond first. A missing Ray ID never starts in Log Explorer. A browser cert warning never starts in WAF. Zero Requests never starts in RuleID.
4. How to choose — first tool + proof field
Do: Print this next to the dashboard. If you cannot recite the proof field, you are not ready to change anything.
| If the ticket says… | First tool (official path) | Proof field | Do not open first |
|---|---|---|---|
| 403 / challenge / “Cloudflare blocked login” | Zone Analytics → Events tab · Sampled logs. Deeplink /security/analytics |
Action (block / managedchallenge / challenge / log / skip) + Service + Rule |
A global WAF skip |
| “This rule should have fired” after you shipped it | Account Trace · /trace (Administrator / Super Administrator) |
Evaluated and executed configurations, in evaluation order | Log Explorer (that is what did happen) |
| Whole site dead / “is Cloudflare even working?” / no Ray ID | Zone Analytics & Logs → HTTP Traffic · /analytics/traffic |
Requests in the UTC window + Edge status code (add Origin status code if you have it) |
A new custom Allow |
| Ray ID on the error page / Sampled logs empty / need the forensic row | Account Log Explorer → Log Search, or zone Analytics & Logs → Logs (Logpush) | RayID + Action + RuleID + Source on firewall_events / http_requests |
Trace Skip Challenge |
| Browser cert warning / padlock broken / not a 403 | Zone SSL/TLS → Edge Certificates · /ssl-tls/edge-certificates |
Certificate Status = Active (and Type / hostnames covered) |
A managed-ruleset skip |
Security Events may use sampled data. Official Ray ID docs: if sampled data is applied, you might not see all events and filters might not return the expected results. Narrow the time window, then escalate the same Ray ID to Log Explorer or a Logpush firewall_events job. Do not declare “no hit” from one empty Sampled-logs page.
Security Events = requests Cloudflare security products acted on or flagged (firewallEventsAdaptive). Security Analytics = all incoming HTTP, including requests nothing touched. Logpush firewall_events = the raw Action / RuleID / Source / RayID dataset you ship to a SIEM. Same family. Three doors.
5. Runbook Side A → B → C
Side A proves the security verdict and the what-if. Side B proves the zone is on the wire and the padlock is valid. Side C proves the forensic row. On a messy Sev-2, do them in this order until a field lights up.
Side A — Security Events + Trace (verdict and what-if)
-
Open Security Events, not the rule editor
Official path: in the Cloudflare dashboard go to the Analytics page for the zone, then select the Events tab. Deeplink:
dash.cloudflare.com/?to=/:account/:zone/security/analytics. Enterprise also has account-level Security events. Source: Security Events — Location in the dashboard. -
Filter, then read the two columns that close a WAF ticket
Add filter: Action, Host, Path, IP, or Ray ID. Expand the Sampled log. Quote
Actionand the applied security feature (Managed rules, Rate limiting rules, Custom rules, Bot Fight Mode). That pair is the ticket. A single HTTP request can generate more than one security event. Source: Security Events — Sampled logs; Event actions. -
If Events is empty, do not invent a skip
Empty Sampled logs means either nothing was actioned/flagged, or sampling hid the row. Switch to Security Analytics (same Analytics page — all traffic) or jump to Side C. Source: Security Analytics vs Security Events.
-
If the question is “would this match?”, open Trace
Path: account Trace ·
dash.cloudflare.com/?to=/:account/trace. Enter a hostname that belongs to the account, HTTP method, optional User-Agent / geolocation / Bot Score / request body. Select Send Trace. Inactive rules are not evaluated. Administrator or Super Administrator only. Source: Use Cloudflare Trace.
Analytics / Events / Sampled logs
Security Events
| Time (UTC) | Action | Service | Rule | Ray ID |
|---|---|---|---|---|
| 01:38:11 | log | Managed rules | 100203 | a1b2c3d4e5f67890 |
| 01:41:07 | managedchallenge | Rate limiting rules | login-20r | a1b2c3d4e5f67891 |
Source: Cloudflare Docs — Security Events (Analytics → Events tab; Sampled logs Action + applied security feature). Lab zone app.example.test only. Training mock · not live.
Trace / Send Trace / Trace results
Trace a request
http_request_firewall_custom · custom rule login-allow-office · skip
http_request_ratelimit · login-20r · managed_challenge
http_request_firewall_managed · Cloudflare Managed Ruleset · no match
Inactive rules were not evaluated.
Source: Cloudflare Docs — Trace a request; Use Cloudflare Trace (account /trace; evaluated and executed configurations). Training mock · not live.
Side B — HTTP Traffic + Edge Certificates (the wire and the padlock)
-
Prove the zone is seeing requests
Path: zone Analytics & Logs page · HTTP Traffic tab. Deeplink:
dash.cloudflare.com/?to=/:account/:zone/analytics/traffic. QuoteRequestsfor the UTC window on the ticket. Filter Host / Path / Edge status code / Origin status code / Security Action if the plan exposes those filters. Source: Zone Analytics — View your website analytics. -
Read Edge status separately from Origin status
Edge status codeis what Cloudflare returned to the client.Origin status codeis what the origin returned on a cache miss. A 403 at the edge with no origin status is a security action. A 526 / 525 at the edge is TLS to origin, not WAF. Source: Zone Analytics — HTTP Traffic filters. -
If the browser shows a cert warning, open Edge Certificates
Path: SSL/TLS → Edge Certificates. Deeplink:
dash.cloudflare.com/?to=/:account/:zone/ssl-tls/edge-certificates. Quote Type (Universal / Advanced / Custom) andStatus. Official HTTP DCV check: Status must be Active. Universal SSL covers the apex and first-level subdomains only. Source: Edge certificates; Changing DCV method — HTTP; General SSL errors. -
Do not confuse Status with encryption mode
Edge Certificates
Statusis the visitor padlock. Encryption mode (Off / Flexible / Full / Full (strict)) lives on SSL/TLS Overview (/ssl-tls). 526 is Full (strict) failing to validate the origin cert. That is a factory ticket, not this Status column.
HTTP Traffic shows Requests in the same minute the user failed. If they reported a padlock error, Edge Certificates Status is Active for that hostname — or you have quoted Pending Validation / missing coverage and stopped chasing WAF.
Side C — Log Explorer / Logpush (the forensic row)
-
When Sampled logs are not enough, leave Events
Official Ray ID page: all customers can look up a Ray ID in Security Events Sampled logs; sampling can hide it. Next official door is Log Explorer. Path: Log Explorer → Log Search. Deeplink:
dash.cloudflare.com/?to=/:account/log-explorer/log-search. Needs the dataset enabled (Manage datasets) and Logs Read. Source: Cloudflare Ray ID; Log Search. -
Query the Ray ID, then read Action + RuleID
Select Dataset (
http_requestsor the firewall-events dataset you enabled). Add filter Field = RayID, or Custom SQL. Official example usesWHERE RayID = '…'. For the security verdict, Logpush field names onfirewall_eventsareAction,RuleID,Source,RayID,Description,EdgeResponseStatus. Source: Log Search; Firewall events dataset. -
If you do not have Log Explorer, use the Logpush job you already run
Path: account Logpush
/logs, or zone Analytics & Logs → Logs/analytics/logs. Create / inspect a job for datasetfirewall_eventsorhttp_requests. Quote the same four fields from the SIEM. Enterprise Instant Logs is a live stream, not a 24-hour hunt. Source: Enable Logpush destinations; Cloudflare Logs.
Log Explorer / Log Search / Custom SQL
Log Search
SELECT EdgeStartTimestamp, ClientRequestHost, ClientRequestPath,
       EdgeResponseStatus, Action, RuleID, Source, RayID
FROM   firewall_events
WHERE  date = '2026-08-16'
  AND  RayID = 'a1b2c3d4e5f67891'
LIMIT 1| RayID | Action | RuleID | Source | EdgeResponseStatus |
|---|---|---|---|---|
| a1b2c3d4e5f67891 | managedchallenge | login-20r | ratelimit | 403 |
Source: Cloudflare Docs — Log Search (dashboard path + WHERE RayID); Firewall events fields (Action, RuleID, Source, RayID). Training mock · not live.
Zone:            app.example.test          (lab)
UTC window:      01:30–01:50
Events path:     Analytics → Events → Sampled logs
Quote:           Action + Service + Rule + Ray ID
If empty:        HTTP Traffic Requests, then Log Explorer WHERE RayID
Trace path:      Account → Trace → Send Trace
Cert path:       SSL/TLS → Edge Certificates → Status
Logpush path:    Analytics & Logs → Logs  (zone)  or  account /logs
- Side A verdict: Sampled log names
Action+ Service + Rule for that Ray ID. Side A what-if: Trace lists the executed configuration in evaluation order. - Side B wire: HTTP Traffic
Requestsexist in the same minute. Side B padlock: Edge CertificatesStatusis Active for the hostname. - Side C: Log Explorer or Logpush returns one row for that
RayIDwithAction+RuleID+Source.
6. Five tickets as full stories
These five land every quarter. Memorise first tool + proof field. Times and identities below are lab-only. Zone app.example.test, client 203.0.113.88.
| Ticket | Symptom | First tool | Proof field |
|---|---|---|---|
| CFED-01 | “Is Cloudflare even working?” — site looks dead, no Ray ID | HTTP Traffic | Requests + Edge status code |
| CFED-02 | After a new rate-limit, /login challenges real users | Security Events | Action = managedchallenge · Rule = the rate-limit |
| CFED-03 | “This custom rule should have fired” after you shipped it | Trace | Executed configuration (or no match) in evaluation order |
| CFED-04 | Ray ID on the error page is missing from Sampled logs | Log Explorer / Logpush | RayID + Action + RuleID + Source |
| CFED-05 | Browser cert warning on a new hostname — not a 403 | Edge Certificates | Status (Active vs Pending Validation) + Type / SAN |
CFED-01 — Prove the wire (HTTP Traffic)
01:42 · P1. Priya: “Cloudflare is down.” No error page, no Ray ID. L1 already drafted a skip for the Cloudflare Managed Ruleset.
First tool: zone Analytics & Logs → HTTP Traffic. Filter last 30 minutes. Host = app.example.test.
If Requests = 0: the edge never saw the client. Quote that count. Next check is DNS / proxy status (orange cloud) / nameservers — not Security Events Action. Grey-cloud hostnames never produce a Cloudflare Ray ID.
If Requests > 0: add filter Edge status code. A pile of 5xx is origin or edge TLS. A pile of 403 / 429 is a security ticket — now you are allowed to open Events. HTTP Traffic is not a rule name.
Do not skip WAF from a Slack screenshot. Unique Visitors is a Web Traffic roll-up, not a verdict. Workers subrequests do not appear in zone Traffic Analytics — they live under Workers & Pages.
CFED-02 — Prove the security transaction (Security Events)
02:05 · P2. After last night’s login rate-limit, humans fail the challenge loop. Someone wants “WAF off for /login.”
First tool: Analytics → Events. Filter Host + Path /login + last hour. Expand Sampled logs.
Proof field: page GET Action = log (Managed rules 100203 did not block). POST Action = managedchallenge and Service = Rate limiting rules, Rule = login-20r. That name is the ticket. Tune that one rule — or raise the threshold — then re-read the same two columns. Challenge is not a block. Source: Security Events — Event actions; Managed Challenge list.
I would not skip the managed ruleset. I would quote Action + Rate limiting rule on the POST. A change is not proof until the same filter returns allow or a solved challenge.
CFED-03 — Prove the what-if (Trace)
02:20 · P2. You shipped a custom skip for the office NAT. Attack traffic still looks challenged. L1 wants the rule rewritten from a HAR guess.
First tool: account Trace. URL https://app.example.test/login, method POST, geolocation = the office country, User-Agent from the HAR. Send Trace.
Proof field: the executed configuration list. If login-allow-office never appears, the expression did not match (IP field, skip-challenge off, or the rule is off). If it appears as skip and a later rate-limit still executes, evaluation order — not “Cloudflare ignored the rule” — is the ticket. Inactive rules are not evaluated. Source: Use Cloudflare Trace — Steps in trace results.
Trace is a simulation. It does not create a Ray ID and it does not appear in Events. After you fix the expression, prove production with a new Events row or a Log Explorer RayID.
CFED-04 — Prove the forensic row (Log Explorer / Logpush)
02:40 · P2. User pasted Ray ID a1b2c3d4e5f67891 from the challenge page. Security Events Sampled logs for that ID is empty. L1 says “so Cloudflare did nothing.”
First tool: Log Explorer → Log Search. Dataset you enabled. Custom SQL WHERE RayID = 'a1b2c3d4e5f67891' and a tight date predicate. If Log Explorer is not on the contract, query the Logpush firewall_events job in the SIEM.
Proof field: Action + RuleID + Source + EdgeResponseStatus on that Ray ID. Official Firewall events Action values include block, managedchallenge, log, skip, bypass. Official Source values include firewallcustom, firewallmanaged, ratelimit, botfight, botmanagement. Empty Sampled logs plus a Log Explorer hit is sampling, not “no event.”
Ray IDs are not guaranteed unique. Official docs say different requests may share a Ray ID. Pair Ray ID with timestamp + path. Do not paste a live customer Ray ID with PII into a public channel.
CFED-05 — Prove the padlock (Edge Certificates Status)
03:00 · P3. New hostname pay.app.example.test. Chrome: “Your connection is not private.” Someone typed Sev-1 and drafted a WAF skip.
First tool: SSL/TLS → Edge Certificates. Look for Type Universal / Advanced / Custom covering that hostname. Quote Status.
Proof field: Universal SSL covers apex + first-level subdomains only. pay.app.example.test is a second-level subdomain — official General SSL errors page. Status Pending Validation, or no certificate that lists the name, is the ticket. Fix coverage (Advanced / Custom / Total TLS) or grey-cloud only if origin already has a valid cert. This is not a 403 and it is not 526.
I would leave WAF alone. I would paste Type + Status + hostnames. If Status is Active on the apex but this hostname is not on the cert, that is coverage — not “Cloudflare is down.”
7. Traps + close-the-ticket proof

| You see | Weak close | Strong close |
|---|---|---|
| HTTP Traffic Requests = 0 | “Cloudflare is down” / skip WAF | Quote Requests = 0; fix DNS / orange cloud; reload Traffic |
| HTTP Traffic Requests > 0, still failing | “Cloudflare is fine” | You only proved the wire. Open Events or Edge status code. |
| Action = managedchallenge | “WAF blocked us” | Challenge is not a block. Quote Service + Rule. Tune that object. |
| Empty Sampled logs | Nothing happened / disable managed rules | Sampling or no action. HTTP Traffic, then Log Explorer RayID. |
| Trace shows a skip | “Production is skipping” | Trace is a simulation. Confirm with Events or Log Explorer. |
| Edge Certificates Status Active | “TLS is fine, so not Cloudflare” | You proved the visitor padlock. 526 is origin + Full (strict). |
| Status Pending Validation / hostname missing | Skip WAF / pause the zone first | Quote Type + Status + SAN. Fix coverage or DCV. |
| Logpush http_requests with no Action | “SIEM proves allow” | Security verdict lives on firewall_events Action + RuleID. |
- UTC window written next to the tool you opened.
- Wire proved with HTTP Traffic
Requestswhen the ticket is “is Cloudflare even working?” - One transaction quoted: Events
Action+ Rule, or Trace executed config, or Log ExplorerRayID+RuleID, or Edge CertificatesStatus. - Next tool named — or change-control owner named. No skip / purge / pause without residual control.
- Peer hostname or second Ray ID compared when you claim “not a tenant outage.”
- Sampled logs not used as the only “no event” proof. 526 not used as Edge Certificates Status.
I name the question, then the first tool, then one official field. Security Events proves the verdict. Trace proves the what-if. HTTP Traffic proves the wire. Log Explorer / Logpush proves the forensic row. Edge Certificates Status proves the padlock. I do not skip a ruleset, pause the zone, or replace an origin cert until that field is on the ticket. Factory model: a Ray ID is a ticket.
Knowledge check
Six night-shift judgments. Each maps to a first tool or a proof field. Check answers, then Reset if you picked the wrong surface.
Sources
- Cloudflare Docs — Security Events (Analytics → Events tab; Sampled logs; Action; sampling;
firewallEventsAdaptive) - Cloudflare Docs — Security Analytics (all HTTP vs actioned-only; Logs → Log Explorer)
- Cloudflare Docs — Trace a request (simulated HTTP/S; Trace vs Log Explorer)
- Cloudflare Docs — Use Cloudflare Trace (dashboard
/trace; Send Trace; executed configurations) - Cloudflare Docs — Zone Analytics (Analytics & Logs → HTTP Traffic; Requests; Edge / Origin status code)
- Cloudflare Docs — Cloudflare Ray ID (Sampled logs lookup; sampling caveat; Log Explorer)
- Cloudflare Docs — HTTP headers (
Cf-Ray) - Cloudflare Docs — Log Explorer
- Cloudflare Docs — Log Search (
/log-explorer/log-search;WHERE RayID) - Cloudflare Docs — Firewall events dataset (
Action,RuleID,Source,RayID) - Cloudflare Docs — Enable Logpush (R2) (account
/logs; zone/analytics/logs) - Cloudflare Docs — Edge certificates (dashboard
/ssl-tls/edge-certificates) - Cloudflare Docs — HTTP DCV (Status = Active)
- Cloudflare Docs — General SSL errors (Universal coverage; Pending Validation)
- Cloudflare Docs — Actions (block, challenge, managed challenge, skip, log)
- Cloudflare Docs — Proxy status (orange cloud vs DNS only)
Related: Blog 1 · Cloudflare session factory · WAF skip tuning · Bot login abuse · WAF troubleshooting command center · Cloudflare WAF hub