fw stat answers “what policy did this gateway actually install, and when?” fw log / SmartConsole Logs answers “what Action, which Rule, which Origin?” fw ctl zdebug drop answers “why did the kernel drop it when there is no log row?” cphaprob state answers “is this member ACTIVE?” SmartView / the Log Server answers “where do the logs actually live?” A green toast is not a DATE. Cluster green is not an Accept.
1. Why “is it working?” is five questions
Operators collapse five failures into one sentence. The gateway never took tonight’s package. Policy dropped the 5-tuple. The kernel dropped it before a log row existed. You SSHed the STANDBY member. SmartConsole is pointed at the SMS while the gateways send logs to a dedicated Log Server. Those are five first clicks.
This page is the night-shift desk for proof. The factory taught the five stamps (topology, installed policy, access rule, NAT, blade). Here you learn the five tools you actually open, in order, when someone asks you to prove Check Point is working.
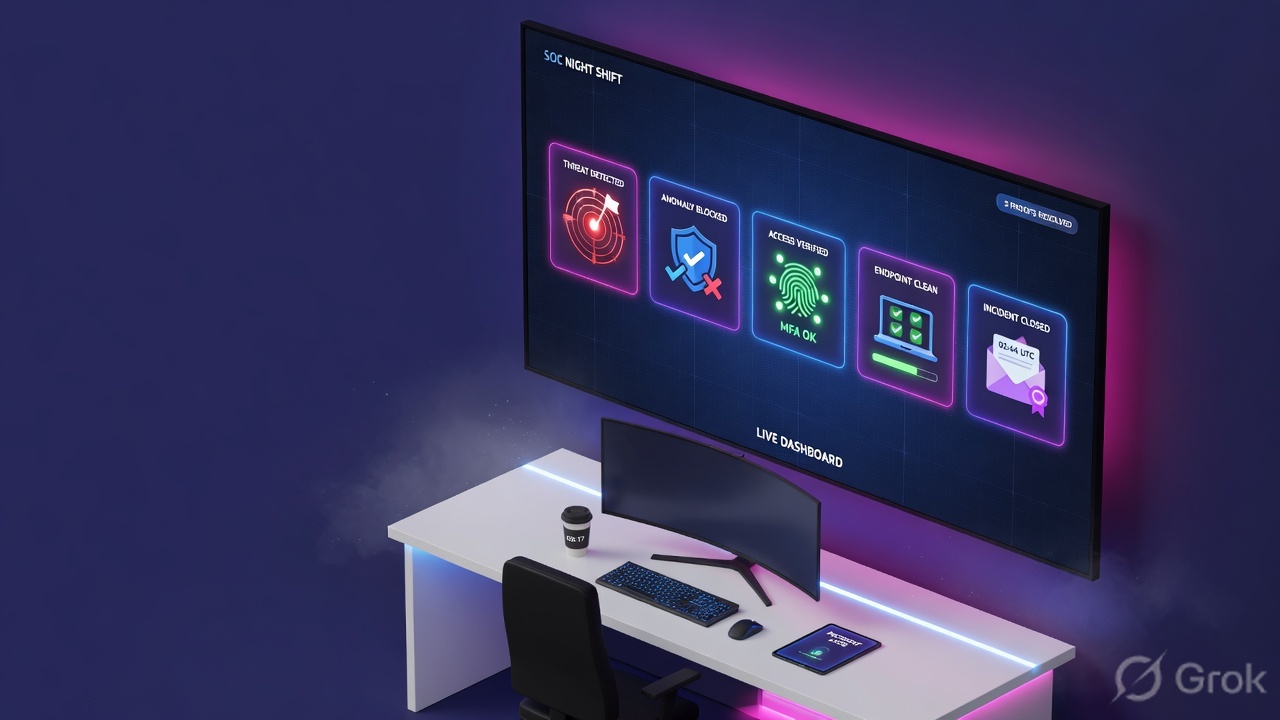
If they say “prove Check Point is working,” do not say “I opened SmartConsole.” Say: “I prove the install with fw stat POLICY + DATE, the transaction with Logs Action + Rule + Origin, a silent kernel drop with fw ctl zdebug drop, the member with cphaprob state, and the log store with SmartView on the Log Server — not the SMS toast.”
2. Mental model — five proof tools
Memorise five named objects before you click. Each tool is allowed to prove one thing. Over-claiming a field is how you ship Any-Any at 02:00.
1 · fw stat
Expert mode on the Security Gateway. Official columns: POLICY (name of the installed policy) + DATE (last policy installation). Does not prove a 5-tuple or who is ACTIVE.
2 · fw log / Logs
CLI fw log -n -c drop, or SmartConsole Logs & Monitor → Logs (R81.20) / Logs & Events → Logs (R82). Proves one transaction: Action + Rule + Origin.
3 · fw ctl zdebug drop
Live kernel drop trace (sk167457, R81.20 / R82). Proves the drop reason when Track is None or the drop never became a log. Short window. Stop it.
4 · cphaprob state
Expert: cphaprob state. Clish: show cluster state. Proof field is member State — ACTIVE, STANDBY, DOWN, READY, INIT. HA Active Up: only ACTIVE forwards.
5 · SmartView / Log Server
Browser: https://<Server IP>/smartview/ on the SMS or the dedicated Log Server / SmartEvent Server. Empty SMS Logs is often the wrong store, not “the firewall is down.”
Hard words, once
SMS = Security Management Server (design plane). Origin = the gateway object that generated the log. Log Server = dedicated store. Official R81 CLI still documents fw stat; it also says use cpstat -f policy fw.
Read left → right. Each box is allowed one claim. If you cannot name the field, you are not proving — you are guessing.
I prove the install, then the log row, then the silent drop, then the member, then the log store. I do not add Any-Any, fail over ClusterXL, or trust the toast until I can quote the field that made me do it.
3. Decision flow — ticket → first tool
Flowchart first. Do not open the Access Control editor until a diamond says so.
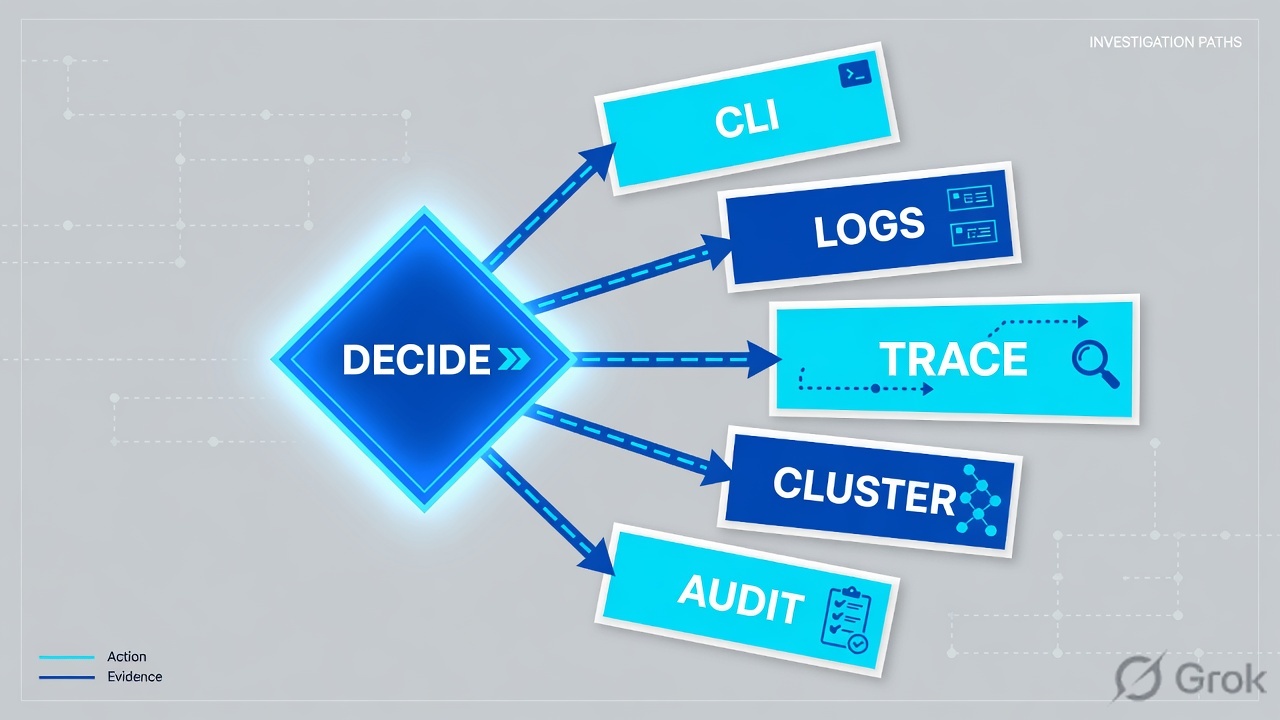
Read the diamond first. Silent drop never starts in the Access editor. Empty SMS Logs never starts as “Check Point is down.” A stale DATE never starts as a new Accept.
4. How to choose — first tool + proof field
Print this next to SmartConsole. If you cannot recite the proof field, you are not ready to change anything.
| If the ticket says… | First tool (official path) | Proof field | Do not open first |
|---|---|---|---|
| After Install Policy / “is Check Point even working?” | Expert on the gateway (ACTIVE member): fw stat. Twin: cpstat -f policy fw |
POLICY (installed policy name) + DATE (last policy installation) |
A new Any-Any; the SMS toast |
| One SaaS / 5-tuple blocked after a policy change | R81.20: Logs & Monitor → Logs. R82: Logs & Events → Logs. CLI twin: fw log -n -l -c drop |
Action (Drop / Accept / Reject / Prevent / Block) + Rule + Origin |
Threat Prevention disable; reboot |
| User fails, Logs empty for that 5-tuple, Track may be None | Expert, short window: fw ctl zdebug drop (sk167457) |
Kernel drop reason (plus Interface / TCP flags on the line) | Unfiltered zdebug left running; Any-Any |
| Cluster “green” / empty connections / you SSHed .12 | Expert cphaprob state or Clish show cluster state |
Member State (ACTIVE / STANDBY / DOWN / READY) + Cluster Mode |
cphastop; calling ClusterXL the outage |
| SmartConsole Logs empty; toast still green | Browser https://<Log Server IP>/smartview/, or Logs tab while connected so you see all Log Servers |
Same Action + Rule + Origin on the server that actually stores the files |
Declaring the gateway down from an SMS-only tab |
R81 / R81.20 Logging and Monitoring: SmartConsole > Logs & Monitor and SmartView at https://<Server IP Address>/smartview/. R82 Logging and Monitoring Clients: the same work lives under SmartConsole > Logs & Events. The Logs view replaced SmartView Tracker. This lesson quotes both labels; do not invent a third menu.
5. Runbook Side A → B → C
Side A proves the gateway (CLI). Side B proves the log row in SmartConsole / SmartView. Side C is the paste that closes the ticket. On a messy Sev-2, do them in this order until a field lights up.
Side A — CLI on the gateway
-
Name who is ACTIVE before you trust any other command
Expert:
cphaprob state. Clish:show cluster state. Official ClusterXL / CLI Reference: in High Availability (Active Up), only one member must beACTIVE; the peer isSTANDBYand does not forward.ACTIVE(!)still forwards but a Critical Device is in problem. QuoteStateand Cluster Mode. If you are on STANDBY, move. Do not debug an empty connections table on the wrong box. -
Prove what this box installed
On that ACTIVE member:
fw stat. Official output headers areHOST,POLICY,DATE. R81 CLI Reference: name of the installed policy, date of the last policy installation, and the interfaces the policy protects ([>eth0]inbound,[<eth0]outbound). The same guide marksfw statas kept for compatibility and points you atcpstat -f policy fw— quotePolicy nameandInstall timefrom that flavor if your runbook prefers it. Either pair is the install proof. The SMS toast is not. -
Read the log file on the box that generated it
fw log -n -l -c drop(and-h <Origin>if you already know the object). Officialfw logfields includeAction,Origin,IfDir,InterfaceName,src,dst,proto,rule_name/rule_uid,layer_name.-nskips DNS (default, and faster).-c dropis the documented action filter; the command still always prints Control (ctl) lines.Alert: spoofis a documented alert type — that is topology, not a missing Accept. -
If there is still no row, take a short zdebug
sk167457 (R81.20, R82):
fw ctl zdebug dropviews drops on the Security Gateway. It is a live kernel debug — reproduce the 5-tuple, quote the drop reason (and Interface / TCP flags on that line), then stop it (Ctrl+C). Do not leave it running. Do not start here if Logs already named a Rule.
sk167457 exists because operators need the kernel reason. It is still a debug on a production firewall. Filter to the 5-tuple in your head (watch only that src/dst), run it for the reproduce window, stop it. If you need hours of drop history, that is fw log / the Log Server — not a debug left attached to the kernel.
Side B — SmartConsole Logs (and SmartView)
-
Open the Logs tab, not the Access editor
R81.20: left pane Logs & Monitor → Logs. R82: Logs & Events → Logs (or Queries). Official search: click Enter Search Query (Ctrl+F) in the query search bar. Time Period first — match the ticket’s UTC window.
-
Filter with documented fields
Working with Logs (rule-log pane) lists Source, Destination, Blade, Action, Service, Port, Source Port, Rule, Origin, User. Searching the Logs (R82) documents the Action filter values: Accept (Access Control allowed), Drop (Access Control blocked, no notify), Reject (TCP RST to the source), Block (URL Filtering / Application Control), Prevent (DLP or Threat Prevention), Detect, Encrypt / Decrypt. Example query:
action:Drop origin:CP-LAB-01 src:192.0.2.25. -
Read Action, then Rule, then Origin
Open the row. Quote
Action,Rule(name and/or number / Rule UID),Origin(the gateway object). AddInterface/ CLIInterfaceNameand, for TCP, the flags you see on the details pane (a Reject officially notifies with TCP RST). IfOriginis the STANDBY member, you asked the wrong box. -
If the SMS Logs tab is empty, change store — not policy
Understanding Logging: gateways send logs to the Management Server by default, or to a dedicated Log Server, or keep them local. To see logs from all Log Servers, connect SmartConsole to the Management Server and stay in the Logs tab. SmartView Web Application is the same real-time view in a browser:
https://<Server IP>/smartview/where Server IP is the SMS or the SmartEvent / Log Server that actually indexed the files. The Install Policy toast never wrote a log row.
Logs & Events / Logs · R81.20 twin: Logs & Monitor / Logs
Logs
| Time | Action | Origin | Rule | Interface | Source → Dest |
|---|---|---|---|---|---|
| 01:41:02 | Accept | CP-LAB-01 | Finance-SaaS | eth1 | 192.0.2.40 → 198.51.100.80 |
| 01:42:19 | Drop | CP-LAB-01 | Cleanup | eth1 | 192.0.2.25 → 198.51.100.80 |
Lab identities and RFC 5737 / 192.0.2.0/24 addresses only. Auto-Refresh is F6 in official Searching the Logs.
Source: R82 Logging and Monitoring — Searching the Logs (Action filter; Logs & Events); R81 Working with Logs (Logs & Monitor → Logs; filters include Action, Rule, Origin). Training mock · not live.
https://<Server IP>/smartview/ · Server IP = SMS or dedicated Log / SmartEvent Server
Logs view
01:42:19 Action: Drop Origin: CP-LAB-01 Rule: Cleanup Interface: eth1
src 192.0.2.25 → dst 198.51.100.80 proto tcp flags: SYN
SMS-only tab was empty. The gateway was logging. You were on the wrong server.
Official: SmartView Default Time Frame is not synchronized with SmartConsole. Export follows SmartView User Preferences.
Source: R82 Logging and Monitoring Clients — SmartView Web Application https://<Server IP>/smartview/; Understanding Logging — dedicated Log Server vs Management Server. Lab IPs only. Training mock · not live.
Side C — what you paste to close the ticket
One paragraph. Named fields. UTC. No toast screenshot.
UTC window:     01:35–01:45
Member:         cphaprob State = ACTIVE on CP-LAB-01 (192.0.2.11)
Install:        fw stat POLICY=Standard DATE=16Aug2026 01:18:04
Log row:        Action=Drop  Rule=Cleanup  Origin=CP-LAB-01
                Interface=eth1  src=192.0.2.25 dst=198.51.100.80 proto=tcp
If no row:      fw ctl zdebug drop reason = <quoted kernel line>  (stopped)
Store:          SmartView on Log Server 203.0.113.20 — not the SMS toast
Next: change-control on THAT rule / topology / member — or close as not-the-firewall- Side A member:
cphaprobState= ACTIVE on the box you used. Side A install:fw statPOLICY+DATEmatch the change window (or you named the lag). - Side A / B transaction: one row with
Action+Rule+Origin. Interface and TCP flags if the drop is spoof or out-of-state. - Side A silent: zdebug drop reason quoted, debug stopped.
- Side B store: the same row on SmartView / the Log Server that actually holds
$FWDIR/logfor that gateway. - Side C: the paste above is in the ticket. No second Accept until residual control is named.
6. Five tickets as full stories
These five land every quarter. Memorise first tool + proof field. Times and identities below are lab-only (RFC 5737 / 192.0.2.0/24).
| Ticket | Symptom | First tool | Proof field |
|---|---|---|---|
| CEVD-01 | “Is Check Point even working?” after a 01:10 install | fw stat on ACTIVE | POLICY + DATE |
| CEVD-02 | Finance HTTPS to SaaS fails after a rule change | Logs tab / fw log -c drop | Action + Rule + Origin |
| CEVD-03 | Same 5-tuple fails; Logs empty; Track may be None | fw ctl zdebug drop | Kernel drop reason |
| CEVD-04 | Cluster object looks fine; you SSHed 192.0.2.12 | cphaprob state | Member State |
| CEVD-05 | SMS Logs empty; toast still green | SmartView on the Log Server | Same Action/Rule/Origin on the real store |
CEVD-01 — Prove the install (fw stat)
01:42 · P2. Change window ended at 01:18. SmartConsole showed Policy installed successfully. Finance still hits yesterday’s cleanup. L1 already drafted Any-Any.
First tool: SSH the ACTIVE member (prove that with cphaprob state if you are not sure), then fw stat.
If DATE is old: quote POLICY + DATE. The toast published a recipe. This box did not take it. Next is per-member install result / FWD — not a new Access rule.
If DATE matches 01:18: the package is live. Now you are allowed to open Logs for the 5-tuple. fw stat is not Action.
Do not trust a colleague’s fw stat from the STANDBY member or from last week’s change notes. The proof is this gateway, this minute. Official twin if your site retired fw stat: cpstat -f policy fw → Policy name + Install time.
CEVD-02 — Prove the transaction (Logs)
02:05 · P2. Outlook-adjacent SaaS (lab dest 198.51.100.80) fails from 192.0.2.25 after last night’s cleanup tidy. Someone wants “another Accept for Any.”
First tool: Logs & Events → Logs (R82) or Logs & Monitor → Logs (R81.20). Query src:192.0.2.25 dst:198.51.100.80 in the last hour. CLI twin: fw log -n -l -c drop.
Proof field: Action = Drop, Rule = Cleanup (or the named rule that actually hit), Origin = CP-LAB-01. That name is the ticket. Change that one rule — or the object it missed — Publish, Install, then re-read the same three columns. If Action is Prevent, you are in Threat Prevention, not Access. If Action is Reject, the source got a TCP RST — quote that; do not call it “the app is down.”
I would not add a second Accept. I would quote Action + Rule + Origin on the failing 5-tuple. Install is not proof until the same filter returns Accept from the same Origin.
CEVD-03 — Prove the silent drop (zdebug)
02:20 · P1. Same 5-tuple. Logs query is empty. The hit rule’s Track column is None, or Anti-Spoofing / an implied path never wrote a row the indexer sees. L1 wants Any-Any “so we get a log.”
First tool: on ACTIVE, fw ctl zdebug drop (sk167457). Reproduce once. Quote the drop reason. Stop the debug.
Proof field: the kernel reason — Address spoofing (topology; factory stamp 1), out-of-state TCP (flags on the line), SecureXL / chain drop, or the implied/rule path. Official Anti-Spoofing: a packet whose source does not belong behind that interface is blocked; configure it under Gateways & Servers → gateway → Network Management → interface Topology / Perform Anti-Spoofing based on interface topology. That is not a missing Accept at the top of Standard.
Empty Logs is the clue the drop never became a Track=Log row. Quote the zdebug reason + Interface. Fix topology or the Track column, then wait for an Action row. Do not leave zdebug running and do not add Any-Any to “generate evidence.”
CEVD-04 — Prove the member (cphaprob)
02:40 · P2. Cluster object in SmartConsole looks fine. You SSHed 192.0.2.12 because it answered first. Connections look empty. Two apps “fail.” L1 wants cphastop.
First tool: cphaprob state / show cluster state.
Proof field: State. Lab: 192.0.2.11 ACTIVE 100% load, 192.0.2.12 STANDBY 0% load, Cluster Mode High Availability (Active Up). Official table: STANDBY waits for the Active member to fail before it forwards. Empty logs / empty fw tab -t connections on STANDBY are expected. Retest the 5-tuple on ACTIVE. DOWN means a Critical Device reports problem — that is a different ticket than “add a rule.”
Cluster green is not application recovery. cphastop is change-control. Reading Logs filtered to the STANDBY Origin will lie to you.
CEVD-05 — Prove the store (SmartView / Log Server)
03:00 · P3. Helpdesk connected SmartConsole to the SMS, opened Logs, saw nothing, typed “Check Point is down.” The toast from 01:18 is still in the screenshot pack.
First tool: confirm where the gateway sends logs (Understanding Logging: Management Server, dedicated Log Server, or local). Then open https://203.0.113.20/smartview/ (lab Log Server) or stay in the SMS Logs tab only after you know that tab queries every Log Server.
Proof field: the same Action + Rule + Origin row, now visible on the server that indexed it. Official note: SmartView and SmartConsole Default Time Frames are not synchronized — do not export “last 15 minutes” from one and argue with “last 7 days” from the other.
I would leave policy alone. I would paste the SmartView URL + the three fields. Empty SMS Logs plus a live fw stat is a store problem or a forwarding problem — not “the firewall is down.”
7. Traps + close-the-ticket proof
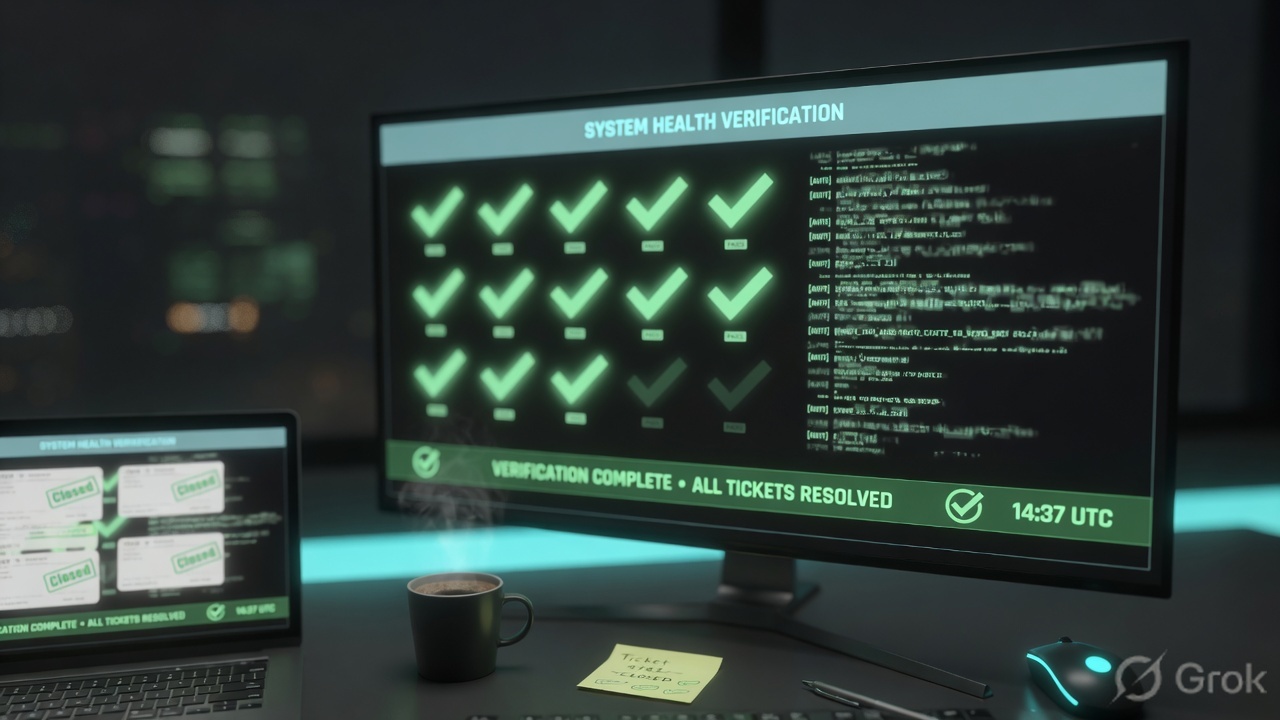
| You see | Weak close | Strong close |
|---|---|---|
| Green Install Policy toast | “Check Point is working” | fw stat POLICY + DATE on ACTIVE |
fw stat DATE is old | A new Accept at the top | Quote DATE; reinstall / fix FWD on that member |
| Logs Action = Drop, Rule = Cleanup | Second Any-Any | Quote Action + Rule + Origin; change that rule |
| Action = Prevent | “Access is broken” | Threat Prevention / DLP — not a new Accept |
| Action = Reject | “The app is down” | Official: gateway notified with TCP RST. Quote Reject. |
| Empty Logs, user still fails | Any-Any “to get a log” | zdebug drop reason, then stop the debug |
| Alert / reason Address spoofing | Missing Accept | Topology / Anti-Spoofing on that Interface. Rule 0 is not cleanup. |
| Cluster object green, SSH .12 | “ClusterXL is down” | cphaprob State = STANDBY; retest ACTIVE |
SMS Logs empty, fw stat live | “The firewall is down” | SmartView / dedicated Log Server |
| Accept in Access, still fails | “Firewall cannot be the cause” | Accept is permission to inspect. Read blade Action / NAT next. |
- UTC window written next to the tool you opened.
- Member proved:
cphaprob stateStateon the box you used. - Install proved when the ticket is “is it working?”:
fw statPOLICY+DATE(orcpstat -f policy fw). - One transaction quoted: Logs
Action+Rule+Origin, or one zdebug drop reason (debug stopped), or SmartView on the real Log Server. - Interface + TCP flags attached when the reason is spoof or out-of-state.
- Next tool named — or change-control owner named. No Any-Any without residual control.
I name the question, then the first tool, then one official field. fw stat proves the install. Logs prove the 5-tuple. fw ctl zdebug drop proves a silent kernel drop. cphaprob state proves the member. SmartView on the Log Server proves the store. I do not change topology, the rulebase, or ClusterXL until that field is on the ticket. Factory model: the SMS toast is not the gateway.
Knowledge check
Six night-shift judgments. Each maps to a first tool or a proof field. Check answers, then Reset if you picked the wrong surface.
Sources
- R81 CLI Reference Guide — fw stat (
POLICY,DATE; compatibility note →cpstat -f policy fw) - R81 CLI Reference Guide — cpstat (fw flavor
policy; Policy name / Install time) - CLI Reference Guide — fw log (
Action,Origin,InterfaceName,IfDir,-c drop,-h <Origin>,Alert: spoof) - R81 CLI Reference Guide — Viewing Cluster State (
cphaprob state/show cluster state;Statevalues) - R81.20 ClusterXL Administration Guide — Viewing Cluster Interfaces
- sk167457 — How to use the fw ctl zdebug command to view drops on the Security Gateway (R81.20, R82)
- R81 Logging and Monitoring — Working with Logs (Logs & Monitor → Logs; Action, Rule, Origin filters)
- R81 Logging and Monitoring — Understanding Logging (Management Server vs dedicated Log Server vs local)
- R82 Logging and Monitoring — Logging and Monitoring Clients (Logs & Events; SmartView
https://<Server IP>/smartview/) - R82 Logging and Monitoring — Searching the Logs (Action values: Accept, Drop, Reject, Block, Prevent, Detect)
- R82 Logging and Monitoring — The Logs View (query bar, Time Period; SMS vs dedicated Log Server indexing note)
- R81 Security Management — Preventing IP Spoofing (Gateways & Servers → Network Management → Topology / Anti-Spoofing)
- sk125152 — Cluster member state-change event codes (referenced from Viewing Cluster State)
Related: Blog 1 · Check Point session factory · Logging & troubleshooting deep dive · ClusterXL deep dive · Troubleshooting command center · Check Point practice dashboard