CloudTrail Event history answers “which API, which identity, which error?” VPC Flow Logs answers “did this 5-tuple ACCEPT or REJECT at the ENI?” GuardDuty Findings answers “what finding type fired, and is it Current?” Security Hub / Config answers “did this control pass or fail for this resource?” CloudWatch Alarms answers “is the metric in OK, ALARM, or INSUFFICIENT_DATA?” A green console icon is not a flow row. A Config rule that exists is not a COMPLIANT evaluation. An empty Event history is not “IAM is fine.”
1. Why “is it working?” is five questions
Operators collapse five failures into one sentence. The API never left a management event. The packet never accepted at the ENI. GuardDuty has been Current for an hour and nobody opened the finding. The CIS control is FAILED because Config is not recording the resource type. The 5xx alarm is INSUFFICIENT_DATA, not OK. Those are five first clicks.
The factory taught the hops: account, then SG versus NACL, implicit deny, WAF versus SG. This page is the night-shift desk for proof. You are already in the account — or you think you are — and someone is asking whether the control even works. You open the tool that is allowed to answer that question, then you quote one official field.
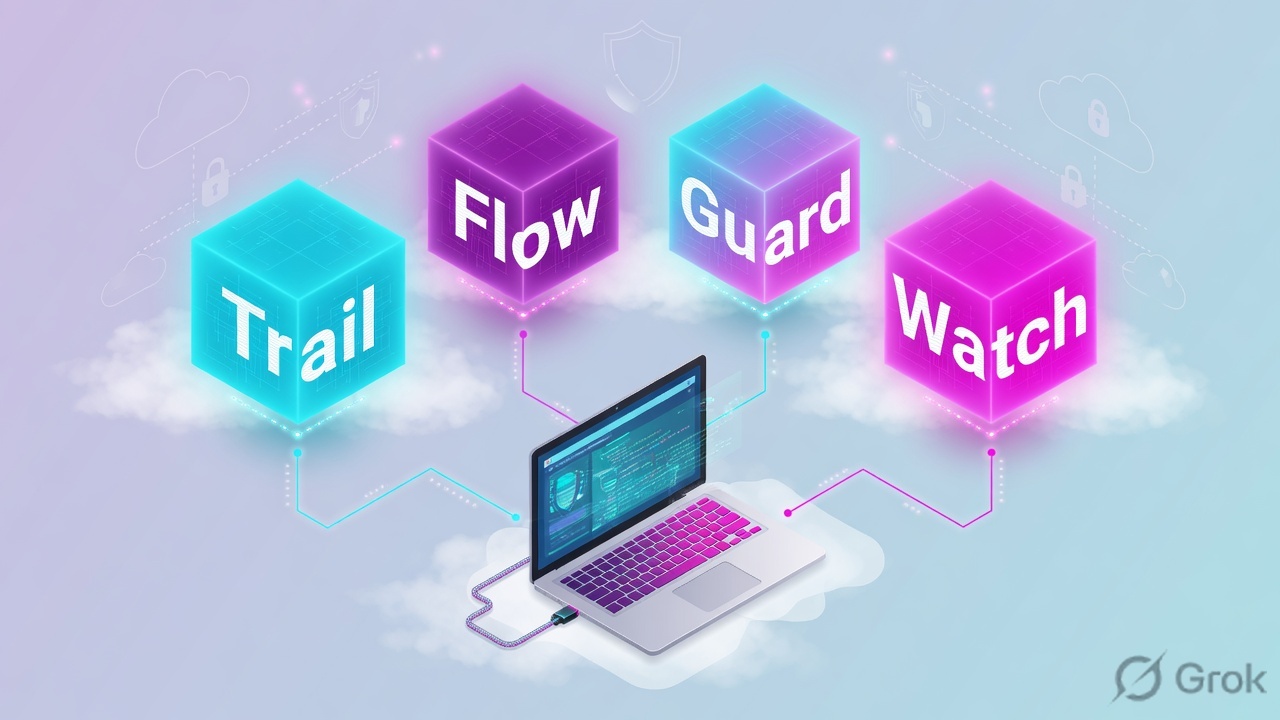
If they say “prove AWS is working,” do not say “I opened the console.” Say: “I prove the API with CloudTrail eventName + errorCode + userIdentity, the packet with Flow Logs action and the 5-tuple, the threat with GuardDuty Finding type, the control with Security Hub Compliance.Status or Config ComplianceType, and the feel with a CloudWatch alarm StateValue plus MetricName.”
2. Mental model — five proof tools
Memorise five named objects before you click. Each tool is allowed to prove one thing. Over-claiming a field is how you ship a bad change at 02:00. The factory named the hop. This desk names the store.
1 · CloudTrail
Event history (90 days, management events, this Region). Proves which API ran: eventName, optional errorCode, userIdentity. Does not prove a packet, and does not show data events such as GetObject.
2 · VPC Flow Logs
CloudWatch Logs → Log groups for the flow-log group. Proves one 5-tuple at the ENI: srcaddr dstaddr srcport dstport protocol + action ACCEPT or REJECT. Does not name the SG rule.
3 · GuardDuty
GuardDuty Findings. Proves a detection: Finding type (and Severity, Resource, Count, Last seen). A finding is a lead. It is not permission to disable a detector or a WAF rule.
4 · Security Hub / Config
Hub Findings / Controls, or Config Rules. Proves whether a check passed: Hub Compliance.Status PASSED / FAILED / WARNING / NOT_AVAILABLE, or Config ComplianceType COMPLIANT / NON_COMPLIANT / INSUFFICIENT_DATA.
5 · CloudWatch
Alarms → All alarms, then the metric. Proves the feel: alarm StateValue OK / ALARM / INSUFFICIENT_DATA plus MetricName, Period, Datapoints to Alarm. A missing datapoint is not “healthy.”
Hard words, once
Management event = control-plane API (Event history). Data event = object/item API (trail or Lake only). 5-tuple = src/dst address + ports + protocol. Finding type = GuardDuty’s formatted string. INSUFFICIENT_DATA = not enough metric points — not OK.
Read left → right. Each box is allowed one claim. If you cannot name the field, you are not proving — you are guessing.
I prove the API, then the packet, then the finding type, then the control evaluation, then the alarm state. I do not open 0.0.0.0/0, attach AdministratorAccess, or disable GuardDuty until I can quote the field that made me do it.
3. Decision flow — ticket → first tool
Flowchart first. Do not open the IAM editor or the security-group inbound rule until a diamond says so. Account and Region still come from the factory: confirm them before the first lookup.
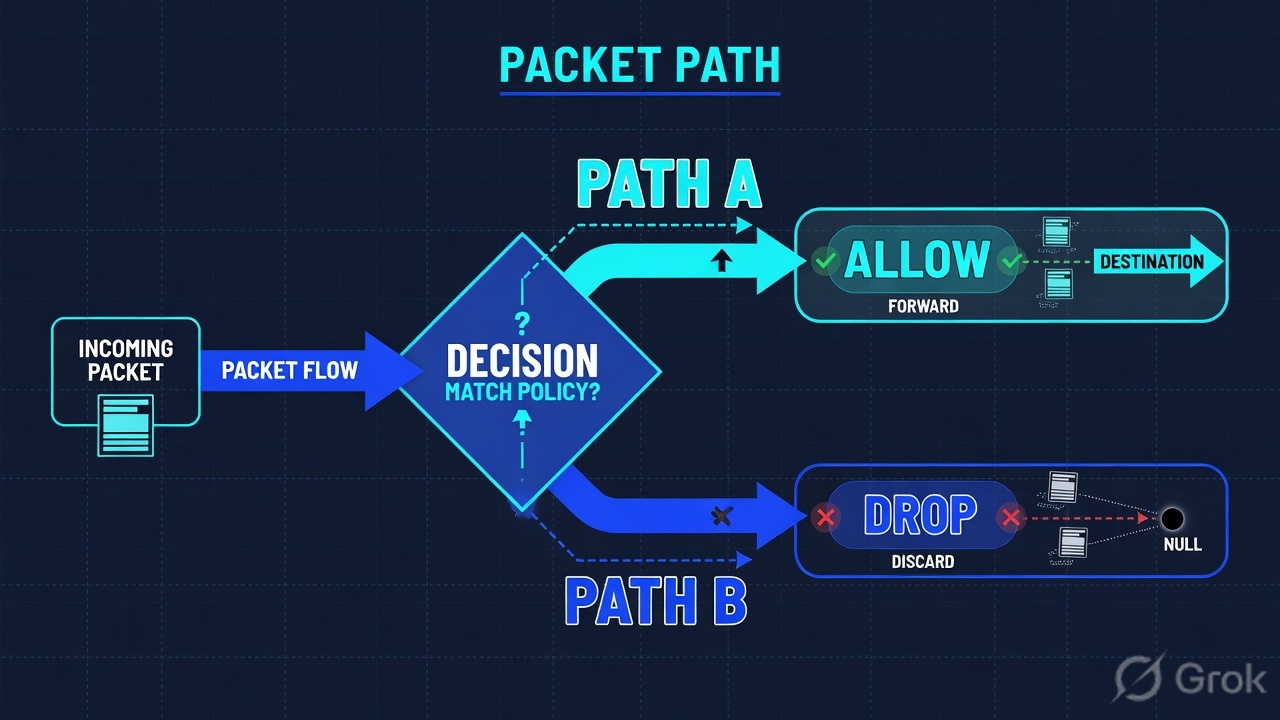
Read the diamond first. A CIS finding never starts in Flow Logs. A partner 443 never starts in Security Hub. “GetObject AccessDenied” never starts as a hunt inside Event history.
4. How to choose — first tool + proof field
Print this next to the Management Console. If you cannot recite the proof field, you are not ready to change anything. Official paths only — docs.aws.amazon.com wording.
| If the ticket says… | First tool (official path) | Proof field | Do not open first |
|---|---|---|---|
| AssumeRole / ConsoleLogin / AuthorizeSecurityGroupIngress failed — “IAM is broken” | CloudTrail Event history · Lookup attribute Event name | eventName + errorCode (e.g. AccessDenied) + userIdentity (type, arn, accountId) |
A new identity Allow, or Flow Logs |
| Partner on the internet cannot hit 443; internal users can | CloudWatch Logs → Log groups → the VPC flow-log group → Search log group | action ACCEPT or REJECT + 5-tuple (srcaddr dstaddr srcport dstport protocol) |
A new 0.0.0.0/0 inbound rule |
| Slack: “GuardDuty High — are we owned?” | GuardDuty Findings (Status = Current) | Finding type (plus Severity, Resource, Count, Last seen) | Disable the detector, or archive without quoting the type |
| Auditor: “Is S3 encryption / public-access even on?” | Security Hub Findings or Controls, or Config Rules | Hub Compliance.Status PASSED / FAILED / WARNING / NOT_AVAILABLE — or Config ComplianceType COMPLIANT / NON_COMPLIANT / INSUFFICIENT_DATA |
A live packet capture, or “the rule exists so it works” |
| ALB 5xx / “the site is slow”; chat wants a rebuild | CloudWatch Alarms → All alarms, then the metric | Alarm StateValue (OK / ALARM / INSUFFICIENT_DATA) + MetricName + Period / Datapoints to Alarm |
A new security-group Allow |
CloudTrail Event history shows the last 90 days of management events in the current Region. It does not show data events. GetObject, PutObject, and DynamoDB GetItem will not appear there. To see those, you need a trail or an event data store with data events enabled. An empty Event history for GetObject is expected — it is not proof that S3 allowed the call.
5. Runbook Side A → B → C
Side A proves the API and the packet. Side B proves the threat finding and the control evaluation. Side C proves the metric the user felt. On a messy Sev-2, do them in this order until a field lights up. Isolate (read-only) until the field is on the ticket. Change-control is a later drawer — that split is in the factory.
Side A — CloudTrail + Flow Logs (API, then packet)
-
Confirm account and Region, then open Event history
Path: sign in to the AWS Management Console → open the CloudTrail console at https://console.aws.amazon.com/cloudtrail/ → in the navigation pane choose Event history. Official: Viewing recent management events with the console. The default filter is Read-only = false (write events). You may apply one attribute filter plus a time range. Clear the default if you also need Describe* / Get* management calls.
-
Filter Event name, then open the Event record
Lookup attribute Event name, full value (CloudTrail cannot filter on a partial value). Examples:
AssumeRole,ConsoleLogin,AuthorizeSecurityGroupIngress,PutBucketPolicy. Choose the event → scroll to Event record. QuoteeventName,errorCodeif present, anduserIdentity(type,arn,accountId,principalId,userNameor assumed-role session). Source: CloudTrail record contents; CloudTrail userIdentity element. -
If the ticket is a packet, switch stores — do not stay in Event history
Path: CloudWatch console at https://console.aws.amazon.com/cloudwatch/ → Logs → Log groups → select the group that receives the VPC flow log → Search log group (or open the ENI log stream). Official: Search flow log records. Flow records are space-delimited. Default format includes
srcaddrdstaddrsrcportdstportprotocol…actionlog-status. -
Read action + 5-tuple, not the SG screenshot
Filter pattern (default format):
[version, accountid, interfaceid, srcaddr, dstaddr, srcport, dstport, protocol, packets, bytes, start, end, action, logstatus]. Narrow with values, e.g.dstport = 443andaction = REJECT. Quote ACCEPT or REJECT plus the five fields.actionis the evidence word. REJECT means SG or NACL (or a closed connection) dropped it — it does not name the rule number. Source: Flow log records — available fields.
CloudTrail / Event history / us-east-1
Event history
| Event name | Event time (UTC) | User name | Event source | Error |
|---|---|---|---|---|
| AssumeRole | 01:38:12 | cicd-bot | sts.amazonaws.com | — |
| AssumeRole | 01:41:07 | cicd-bot | sts.amazonaws.com | AccessDenied |
"eventName": "AssumeRole",
"errorCode": "AccessDenied",
"userIdentity": { "type": "IAMUser", "accountId": "123456789012", "userName": "cicd-bot", "arn": "arn:aws:iam::123456789012:user/cicd-bot" }
Source: AWS CloudTrail User Guide — Viewing recent management events with the console; CloudTrail record contents (eventName, errorCode, userIdentity). Lab identities only. Training mock · not live.
CloudWatch / Logs / Log groups / /vpc/flow / Search log group
Filter events
| srcaddr | dstaddr | srcport | dstport | proto | action |
|---|---|---|---|---|---|
| 10.0.8.22 | 10.0.9.10 | 48211 | 443 | 6 | ACCEPT |
| 203.0.113.88 | 10.0.9.10 | 53102 | 443 | 6 | REJECT |
Source: Amazon VPC User Guide — Search flow log records; Flow log records (fields srcaddr, dstaddr, srcport, dstport, protocol, action ACCEPT / REJECT). Lab IPs only (RFC 5737 203.0.113.88). Training mock · not live.
Side B — GuardDuty + Security Hub / Config (threat, then control)
-
Open Findings, not the detector settings
Path: GuardDuty console at https://console.aws.amazon.com/guardduty/ → left navigation Findings. Default sort is Last seen descending. Status menu = Current (not Archived). Official: Viewing generated findings in GuardDuty console. Choose the finding Title to open the details panel.
-
Quote Finding type before you contain or suppress
Overview fields: Finding type, Account ID, Severity (Critical / High / Medium / Low), Resource ID, Count, Created at, Updated at. The type is a formatted string such as
UnauthorizedAccess:IAMUser/MaliciousIPCaller.CustomorCredentialAccess:IAMUser/AnomalousBehavior. That string is the ticket. Contain the principal (Side A CloudTrail for the same window). Do not archive from Slack text. Source: Finding details; GuardDuty finding types. -
If the ticket is “is the control on?”, switch to Hub or Config
Security Hub CSPM: https://console.aws.amazon.com/securityhub/ → Findings, or Controls, or Security standards → View results. Quote
Compliance.Status: PASSED, FAILED, WARNING, NOT_AVAILABLE. Config: https://console.aws.amazon.com/config/home → Rules. Quote the rule name andComplianceType: COMPLIANT, NON_COMPLIANT, INSUFFICIENT_DATA. A rule that exists is not an evaluation. -
Treat WARNING / INSUFFICIENT_DATA as a recording problem, not a pass
Hub WARNING often means AWS Config resource recording is not on for that type. Config cannot evaluate a type it is not recording (example:
cloudtrail-enabledwith trail recording off). Official: you must recordAWS::Config::ResourceCompliancefor accurate compliance. Do not tell the auditor “green” from a WARNING row.
GuardDuty / Findings / Current / us-east-1
Findings
| Finding type | Severity | Resource | Count | Last seen |
|---|---|---|---|---|
| UnauthorizedAccess:IAMUser/MaliciousIPCaller.Custom | High | AccessKey / cicd-bot | 4 | 01:41 UTC |
| Recon:EC2/PortProbeUnprotectedPort | Low | Instance i-0lab | 12 | 01:10 UTC |
Finding type: UnauthorizedAccess:IAMUser/MaliciousIPCaller.Custom
Account ID: 123456789012 · Region: us-east-1 · Status: Current
Source: Amazon GuardDuty User Guide — Viewing generated findings in GuardDuty console; Finding details (Finding type, Severity, Resource, Count). Lab identities only. Training mock · not live.
Security Hub CSPM / Controls / S3.4
S3.4 — S3 buckets should have server-side encryption enabled
| Resource | Compliance.Status | Workflow.Status | Updated |
|---|---|---|---|
| arn:aws:s3:::lab-app-uploads | FAILED | NEW | 01:20 UTC |
| arn:aws:s3:::lab-logs | PASSED | RESOLVED | 00:10 UTC |
Source: AWS Security Hub User Guide — Evaluating compliance status and control status (Compliance.Status PASSED / FAILED / WARNING / NOT_AVAILABLE; control status Passed / Failed / Unknown / No data / Disabled). Training mock · not live.
Path:            Config console → Rules
Rule name:       s3-bucket-server-side-encryption-enabled
Quote:           ComplianceType = NON_COMPLIANT
Resource:        AWS::S3::Bucket lab-app-uploads
If INSUFFICIENT_DATA: recording / first evaluation — not a pass
Prerequisite:    record AWS::Config::ResourceCompliance
Side C — CloudWatch metric + alarm (the path the user felt)
-
Open All alarms, not a random dashboard tile
Path: CloudWatch console → Alarms → All alarms. Official create/view path uses this pair (Create a CloudWatch alarm based on a static threshold). Filter by state if the ticket says “nothing fired.” Choose the alarm name.
-
Quote StateValue and MetricName together
Metric alarm states:
OK(within threshold),ALARM(outside threshold),INSUFFICIENT_DATA(just started, metric missing, or not enough points). Also quoteMetricName, namespace, dimensions (LoadBalancer, TargetGroup), Statistic, Period, Evaluation Periods, Datapoints to Alarm. Source: Alarm evaluation. -
If the alarm is INSUFFICIENT_DATA, prove the metric exists
Path: CloudWatch → Metrics → All metrics. Metrics with no new datapoints for two weeks do not appear in Browse. An alarm that never leaves INSUFFICIENT_DATA is not a healthy control — the metric is missing, the dimension is wrong, or the period is longer than the incident. Do not close “AWS is fine” from a grey tile.
CloudWatch / Alarms / All alarms / lab-alb-5xx
lab-alb-5xx
INSUFFICIENT_DATA would mean: metric missing or not enough points — not OK
Source: Amazon CloudWatch User Guide — Alarm evaluation (states OK / ALARM / INSUFFICIENT_DATA); Using Amazon CloudWatch alarms; Create a CloudWatch alarm based on a static threshold (Alarms → All alarms). Training mock · not live.
- Side A API: Event record names
eventName+errorCode(or its absence) +userIdentity.arnin the ticket window and Region. - Side A packet: flow row names ACCEPT or REJECT plus the 5-tuple for that ENI.
log-statusis OK, not SKIPDATA. - Side B threat: Findings → Current → Finding type quoted; principal contained before any suppress rule.
- Side B control: Hub
Compliance.Statusor ConfigComplianceTypeon the resource ARN — not “the rule is enabled.” - Side C: alarm
StateValue+MetricName; INSUFFICIENT_DATA investigated, not celebrated.
6. Five tickets as full stories
These five land every quarter. Memorise first tool + proof field. Times, ARNs, and IPs below are lab-only (account 123456789012, Region us-east-1, RFC 5737 203.0.113.88).
| Ticket | Symptom | First tool | Proof field |
|---|---|---|---|
| AWEVD-01 | CI cannot assume AppRole after a policy ship | CloudTrail Event history | eventName = AssumeRole · errorCode = AccessDenied · userIdentity |
| AWEVD-02 | Partner cannot hit ALB :443; corp 10/8 can | VPC Flow Logs in CloudWatch Logs | action = REJECT + 5-tuple for 203.0.113.88 → 10.0.9.10:443 |
| AWEVD-03 | Slack: GuardDuty High on cicd-bot | GuardDuty Findings (Current) | Finding type UnauthorizedAccess:IAMUser/MaliciousIPCaller.Custom |
| AWEVD-04 | Auditor: is S3 encryption even on? | Security Hub Controls / Config Rules | Compliance.Status = FAILED or Config NON_COMPLIANT on lab-app-uploads |
| AWEVD-05 | Checkout 5xx; chat wants the ALB rebuilt | CloudWatch Alarms → All alarms | StateValue = ALARM · MetricName = HTTPCode_Target_5XX_Count |
AWEVD-01 — Prove the API (CloudTrail)
01:42 · P2. Pipeline red after last night’s IAM ship. L1 already drafted AdministratorAccess “to test.” Screenshot of the CodeBuild log says AccessDenied, no JSON.
First tool: CloudTrail Event history, this Region. Lookup attribute Event name = AssumeRole. Time range = the UTC window on the ticket. One attribute plus time — that is the official limit.
Proof field: Event record eventName = AssumeRole, errorCode = AccessDenied, userIdentity.type = IAMUser, userIdentity.userName = cicd-bot, userIdentity.accountId = 123456789012. That triple is the ticket. The factory then names which hop denied (identity policy, trust policy, SCP, permissions boundary). This desk only proves the API fired and failed.
Do not hunt GetObject in Event history. Official: Event history does not show data events. Empty list after an Event name filter of GetObject is expected. Open a trail or Lake with S3 data events, or ask for the application’s error JSON. Do not attach an Allow from an empty management page.
AWEVD-02 — Prove the packet (VPC Flow Logs)
02:05 · P2. Partner on 203.0.113.88 cannot reach the ALB. Internal 10/8 works. Network wants 0.0.0.0/0 on 443 “for five minutes.”
First tool: CloudWatch Logs → Log groups → /vpc/flow → Search log group. Filter default-format fields with dstport = 443. Confirm the ENI is the ALB’s, not a random instance.
Proof field: 10.0.8.22 → 10.0.9.10:443 proto 6 ACCEPT; 203.0.113.88 → 10.0.9.10:443 proto 6 REJECT. That pair is the ticket. Next hop (factory): read the SG source, then the NACL if SG looks right and the client still hangs. Change-control, if approved: /32 + Description, never 0.0.0.0/0.
I would not rebuild the ALB. I would quote REJECT + the 5-tuple. ACCEPT on the corp 5-tuple in the same minute proves the target is alive. SKIPDATA is a capacity skip — not a deny, not an allow.
AWEVD-03 — Prove the finding type (GuardDuty)
02:20 · P1. Slack paste of a High finding. Someone wants the detector paused “until we know.” Someone else wants the WAF web ACL deleted.
First tool: GuardDuty Findings, Status = Current. Open the Title. Do not start from Archived. Do not start from a forwarded email that lost the type string.
Proof field: Finding type = UnauthorizedAccess:IAMUser/MaliciousIPCaller.Custom, Severity High, Resource = AccessKey / cicd-bot, Count 4, Last seen 01:41 UTC. That type is the ticket. Next: Side A CloudTrail for the same principal and window (ConsoleLogin, AssumeRole, CreateAccessKey). Isolate the key. A finding is a lead — official GuardDuty docs treat it as something to review, not as a change-control approval.
Archiving or adding a suppression rule is change-control on the detection path. Contain first. Sample findings (Additional information → Sample = true) are not incidents. Confidence = 0 is the official false-positive hint — still quote the type before you ignore it.
AWEVD-04 — Prove the control (Security Hub / Config)
02:40 · P3. Auditor on the bridge: “You said S3 encryption is on. Prove the control is working.” L1 pasted the Config rule name. No evaluation.
First tool: Security Hub Controls (or Security standards → View results) for the control, or Config Rules for s3-bucket-server-side-encryption-enabled. Open the resource lab-app-uploads.
Proof field: Hub Compliance.Status = FAILED (control status Failed) on arn:aws:s3:::lab-app-uploads, or Config ComplianceType = NON_COMPLIANT. PASSED / COMPLIANT is the only close that the encryption check is working for that bucket. WARNING or INSUFFICIENT_DATA means you cannot see — usually recording. “The rule is enabled” is not an evaluation.
I would not screenshot the Rules list. I would paste Compliance.Status or ComplianceType plus the resource identifier and the evaluation time. Hub control status typically refreshes from the last 24 hours of findings — a brand-new enable can sit at No data.
AWEVD-05 — Prove the metric (CloudWatch)
03:00 · P2. Checkout 5xx. Chat typed Sev-1 and “rebuild the ALB.” Flow Logs already ACCEPT the client 5-tuple. CloudTrail is quiet.
First tool: CloudWatch Alarms → All alarms → lab-alb-5xx. Then the metric graph for HTTPCode_Target_5XX_Count.
Proof field: StateValue = ALARM, MetricName = HTTPCode_Target_5XX_Count, Sum > 10 for 3 of 3 sixty-second periods, dimension LoadBalancer = app/lab-alb/0lab. If the alarm is INSUFFICIENT_DATA, the control is not working — the metric never arrived. That is a metric/dimension ticket, not a security-group ticket.
I would leave the SG alone. I would paste State + MetricName + threshold + the UTC of the first ALARM transition (History tab). ACCEPT on the 5-tuple plus ALARM on 5xx is an application or target ticket, not “AWS is down.”
7. Traps + close-the-ticket proof
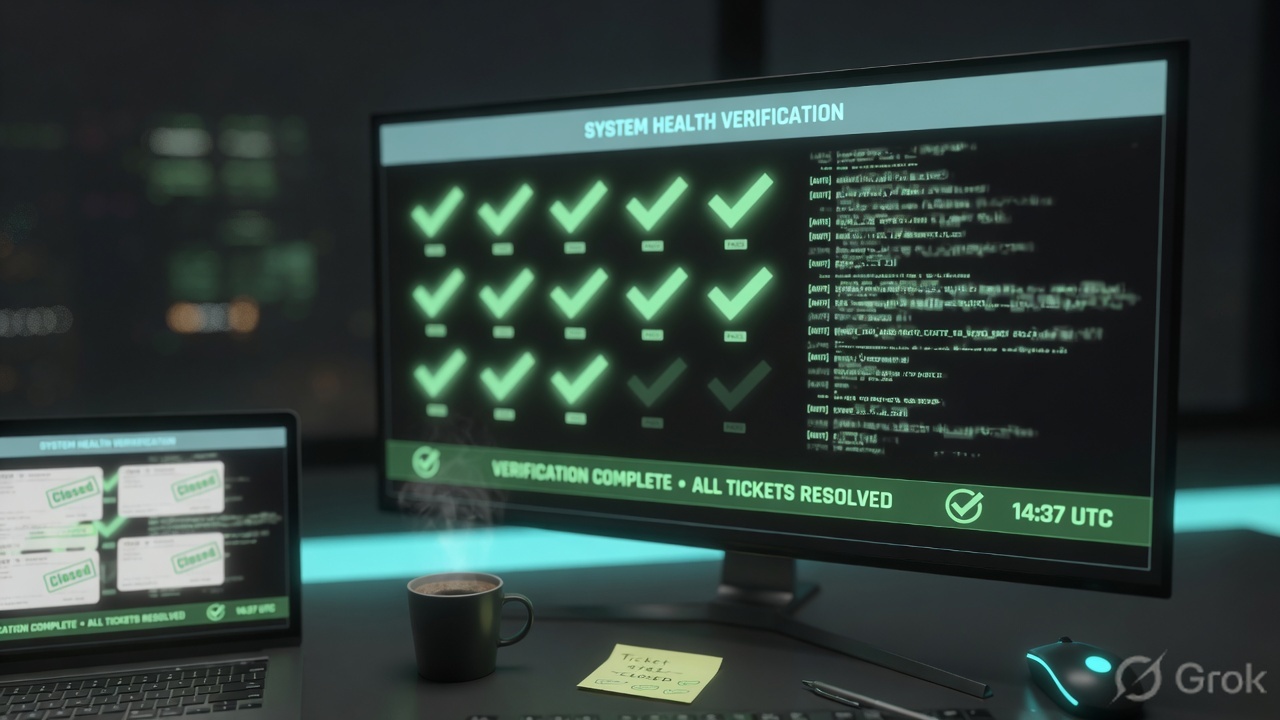
| You see | Weak close | Strong close |
|---|---|---|
| Event history empty for GetObject | “IAM is fine” / attach AdministratorAccess | Data events are not in Event history. Open a trail / Lake, or switch diamond to Flow Logs |
| AssumeRole + AccessDenied | New Allow on a different role | Quote eventName + errorCode + userIdentity.arn, then name the hop (trust / identity / SCP) |
| Flow REJECT on public 5-tuple, ACCEPT on 10/8 | 0.0.0.0/0 for five minutes | Quote action + 5-tuple; /32 + Description under change-control |
| Flow SKIPDATA | “The ENI is dropping” | SKIPDATA is a skipped interval. Re-query; do not treat as REJECT |
| GuardDuty High in Slack | Pause the detector / delete the web ACL | Quote Finding type on Current; contain the principal; CloudTrail next |
| Config rule listed as enabled | “The control is working” | Quote ComplianceType or Hub Compliance.Status on the resource |
| Hub WARNING / Config INSUFFICIENT_DATA | Tell the auditor PASSED | Recording is off or the check has no data. Fix recording, then re-read |
| Alarm INSUFFICIENT_DATA | “No alarm, so healthy” | Metric missing or not enough points. Browse All metrics; fix dimension / period |
| Wrong account / Region | Edit sg-0lab anyway | Switch profile. Re-open Event history in the ticket Region. No writes |
- Account ID + Region + UTC window written next to the tool you opened.
- API tickets quote
eventName+errorCode+userIdentityfrom the Event record (or from a trail / Lake if it is a data event). - Packet tickets quote
action+ the 5-tuple.log-statusis OK. - Threat tickets quote Finding type on Current. Containment named. No detector pause without change-control.
- Control tickets quote Hub
Compliance.Statusor ConfigComplianceTypeon a resource identifier — not the rule’s existence. - Feel tickets quote alarm
StateValue+MetricName. INSUFFICIENT_DATA is investigated. - Next tool named — or change-control owner named. No
0.0.0.0/0. No AdministratorAccess “to test.”
I name the question, then the first tool, then one official field. CloudTrail proves the API. Flow Logs prove the packet. GuardDuty proves the finding type. Security Hub / Config prove the control evaluation. CloudWatch proves the metric state. I do not change a security group, an IAM policy, or an alarm until that field is on the ticket. Hops and isolate-versus-change: AWS Security factory.
Knowledge check
Six night-shift judgments. Each maps to a first tool or a proof field. Check answers, then Reset if you picked the wrong surface.
Sources
- AWS CloudTrail User Guide — Viewing recent management events with the console (Event history; Lookup attributes; Read-only default; 90 days)
- AWS CloudTrail User Guide — Working with CloudTrail event history
- AWS CloudTrail User Guide — CloudTrail record contents (
eventName,errorCode,userIdentity,eventTime) - AWS CloudTrail User Guide — CloudTrail userIdentity element
- AWS CloudTrail User Guide — Understanding CloudTrail events (management vs data events; Event history does not show data events)
- Amazon VPC User Guide — Logging IP traffic using VPC Flow Logs
- Amazon VPC User Guide — Flow log records (
actionACCEPT / REJECT; 5-tuple fields) - Amazon VPC User Guide — Search flow log records (CloudWatch Logs → Log groups → Search log group)
- Amazon VPC User Guide — Publish flow logs to CloudWatch Logs
- Amazon GuardDuty User Guide — Viewing generated findings in GuardDuty console (Findings; Current / Archived)
- Amazon GuardDuty User Guide — Finding details (Finding type, Severity, Resource, Count)
- Amazon GuardDuty User Guide — GuardDuty finding types
- Amazon GuardDuty User Guide — Severity levels of GuardDuty findings
- AWS Security Hub User Guide — Evaluating compliance status and control status (
Compliance.StatusPASSED / FAILED / WARNING / NOT_AVAILABLE) - AWS Security Hub User Guide — Reviewing finding details and history (Findings / Controls / Security standards)
- AWS Security Hub User Guide — Reviewing the details of a security standard (Security standards → View results)
- AWS Config Developer Guide — Viewing details and compliance information for your AWS Config rules (Rules page)
- AWS Config Developer Guide — Viewing compliance information and evaluation results
- Amazon CloudWatch User Guide — Alarm evaluation (OK / ALARM / INSUFFICIENT_DATA; Period; Datapoints to Alarm)
- Amazon CloudWatch User Guide — Using Amazon CloudWatch alarms
- Amazon CloudWatch User Guide — Create a CloudWatch alarm based on a static threshold (Alarms → All alarms)
Related: Blog 1 · AWS Security factory · Security groups vs NACLs · IAM security · GuardDuty + Security Hub · Security Hub CSPM findings · AWS Security practice dashboard