Start here · understand the lesson before the detail
What you are learning
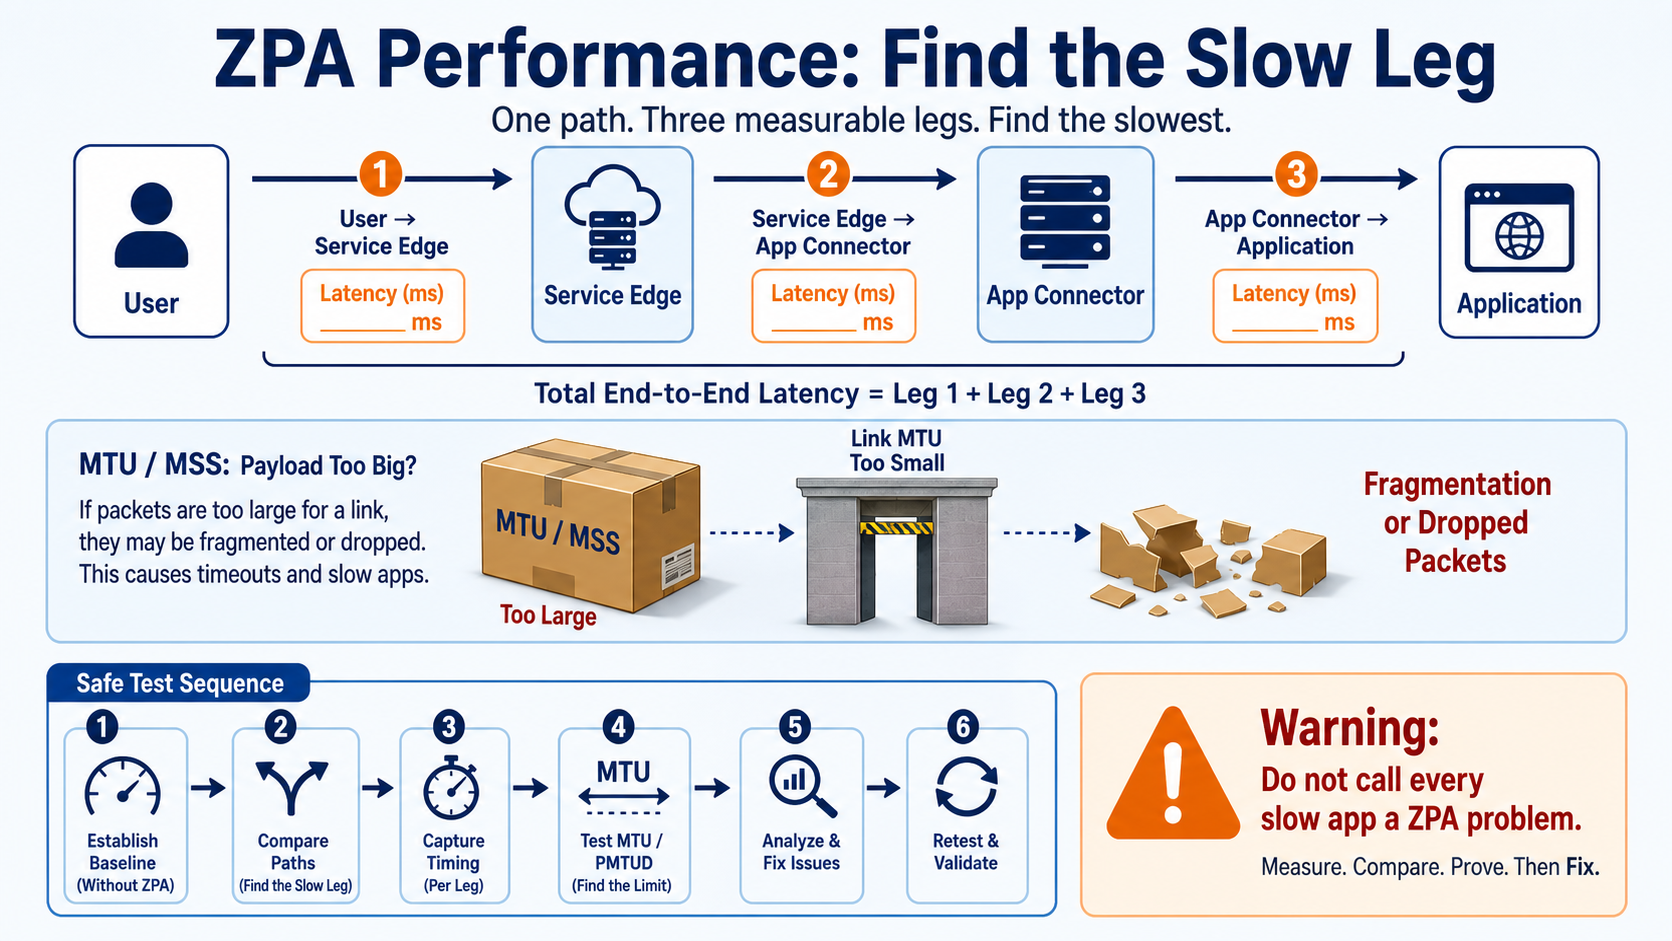
This lesson turns 'ZPA is slow' into measurements. You will break the path into user-to-edge, edge-to-connector, and connector-to-application legs, compare a direct baseline, and understand when MTU or MSS can affect performance.
In plain English
End-to-end speed is the result of several networks and the application itself. A small path MTU can fragment or drop packets, but MTU is only one possible cause. Measure timing at each leg before changing tunnel settings or moving infrastructure.
Real example
Payroll opens quickly on the office LAN but large reports stall through Client Connector. A direct baseline proves the server is healthy. Packet and timing evidence then shows large tunneled packets fail across one internet hop. A temporary MTU test confirms the cause before the permanent network fix.
Follow this flow
- Scope one repeatable slow action, file size, user, device, network, and time.
- Measure a safe direct or alternate-path baseline when policy permits.
- Compare user-to-edge, edge-to-connector, and connector-to-app latency and loss.
- Review connector capacity, app response time, transport, MTU, MSS, and PMTUD evidence.
- Change one proven cause, repeat the exact action, and compare before and after.
Evidence to collect
- Baseline without ZPA or from a known-good path
- Per-leg latency, loss, retransmissions, and application timing
- Tunnel protocol, MTU/MSS, PMTUD, and packet-size tests
- Connector CPU/load, app server response, and retest
Common mistake to avoid
Do not make a lower MTU or older tunnel mode the permanent answer just because one test improved. Zscaler documents these as diagnostic directions; identify the limiting network hop and choose the supported long-term correction.
Current official source checkpoint
- ZPA performance runbookcurrent official reference used for this beginner explanation
- Client Connector performance runbookcurrent official reference used for this beginner explanation
Key terms before you continue
The belief that "it works, so it's fine"
Most engineers treat ZPA as binary: the app opens, so ZPA is healthy. Wrong — and that wrong instinct is exactly why a "ZPA is slow" ticket sits open for days. An app that opens can still be brokered through a Service Edge on the wrong continent, can stall on every large transfer because the MTU shrank under the microtunnel's encryption, or can brown out at 6 PM because one connector is carrying the whole site. The session "works." The path is slow.
Here's the daily-life version: a parcel too big for the letterbox gets returned to the post office — and nobody tells the sender. That's exactly MTU black-holing: the oversized packet is dropped silently, the app just "hangs." So the senior move is never "does it open?". It's "which hop is eating the latency or the packet, and what does the right tool measure there?" This blog teaches the path first, then walks 16 performance scenarios that live along it.
If your problem is "Disconnected / won't enroll" rather than "slow," that's a different lesson — see App Connector troubleshooting for enrollment, broker and health failures. This blog assumes the connector is up and the app opens — we only chase speed here.
No scoring. Just notice which ones you can't answer yet — those are the sections to slow down on. We answer all three as you scroll.
- A Bengaluru user's private app "works" but every click lags ~200 ms. The connector is healthy. What single thing tells you which Service Edge they landed on?
pingto the app succeeds and small web pages load, but RDP and large file copies hang. Which one property of the path is almost certainly wrong?- An app is fast all day and slow only at 6 PM. Is that latency, MTU, or capacity — and what's the one command on the connector host that decides it?
The big picture — where latency and MTU are spent
A ZPA session is stitched together by the cloud: the user's ZCC dials a Service Edge (ZEN), and your App Connector dials the same brokering layer outbound from beside the app. Every byte rides a microtunnel across two legs. So slowness has exactly two physics to blame: distance (latency — how far the chosen ZEN and the app are) and packet size (MTU — how much of each packet is real payload after the TLS wrappers). Plus the connector's own headroom. Learn where those three live on the path and every "slow" ticket sorts itself.
Your performance toolbox — tap each card
These six are the commands and tools you'll reach for in every scenario below. Memorise the front of each card; the back tells you what it proves.
Runs 20 probes per hop and prints loss% and latency per hop — so you see exactly where RTT or packet loss enters the path. Your first command when "everything is laggy."
Sends a Don't-Fragment packet of a fixed size. Shrink the size until it passes to find the real path MTU. The single most-skipped test for "big transfers hang."
Walks each hop and prints the pmtu as it discovers it — names the hop that lowered the MTU (often an overlay/tunnel), without needing root.
top shows CPU/RAM saturation; ss -s shows the socket/conntrack count. The pair that proves a peak-hour brownout vs a steady-state problem.
The connector resolves app FQDNs itself. dig prints a Query time — anything over ~50 ms (or a SERVFAIL/failover) explains a slow first connect that's fast after.
Zscaler Digital Experience plots hop-by-hop latency, page-load and the selected Service Edge for the real user — the one tool that spans ZCC → ZEN → connector → app. Your root-cause map.
Watch a packet cross the microtunnel — and see where it stalls
Before the scenarios, run this once. Press Play and watch a single 1500-byte packet get wrapped, lose room to the TLS layers, and hit the wall at the narrow hop. Stage 4 turns red — that's MTU black-holing, the exact moment a "working" app starts hanging on big transfers.
▶ MTU on the microtunnel — 6 stages
Press Play (auto-steps), or tap Next to walk it yourself. Stage 4 turns red — that's where an oversized Don't-Fragment packet gets silently dropped.
Bucket 1 — Latency & wrong Service-Edge geo
📍 Scenario. Sneha at Infosys Bengaluru opens the ERP app over ZPA. It loads — but every screen drags by ~200 ms and she calls it "laggy." The connector is green, CPU is idle, no errors anywhere. Nothing is "broken." So why does it feel like she's reaching across the planet? Because she might be — through a Service Edge two continents away.
Symptoms here all share one trait: the app is uniformly slow — high RTT on every interaction, fast or slow transfer alike, with no errors. The cause is geography: the client landed on a far Public Service Edge, or the app server is far from the connector. The tools that tell you are ZPA Admin → Diagnostics (which ZEN was selected) and ZDX Cloud Path (per-hop latency for the real user).
Sneha's ERP app "works" but lags on every click. The connector is healthy and idle. Latency is uniform — typing, clicking, page loads all carry the same ~150–200 ms penalty.
- The client landed on a far Public Service Edge (Bengaluru user brokered through an EU/US ZEN)
- Geo/sub-cloud or steering policy points users at a distant region
- Closer ZENs are unreachable (firewall/PAC), so the client fell back to a far one
First confirm which Service Edge was chosen — ZPA Admin > Diagnostics, and ZDX Cloud Path for the user. Then measure the path from the connector host.
mtr -rwzbc20 erp.tcs.local
HOST: conn01            Loss%  Snt   Avg  Best  Wrst
  1.|-- gw.mum.dc            0.0%   20   0.4   0.3   0.9
  2.|-- zen-fra.zscaler       0.0%   20 158.6 152.1 171.0   # Frankfurt ZEN!
  3.|-- erp.tcs.local         0.0%   20   1.1   0.9   2.3
# 158 ms enters at the Service Edge, not the app — geo problem
Steer users to a near ZEN: allowlist the closer Service-Edge ranges, correct the sub-cloud/geo policy, and confirm the right region. For a critical site, deploy a Private Service Edge near the users so brokering stays local. (Connector placement is SCN-02.)
ZDX Cloud Path shows a nearby ZEN; mtr RTT drops from ~160 ms to < 20 ms. Sneha reports the app feels instant again.
The ZEN is near and fine, but the app is still laggy. The connector that serves this app sits in a different region/DC than the app server, so the connector↔app leg carries the latency.
The App Connector is deployed far from the app (e.g. a Mumbai connector serving an app hosted in Singapore over a slow inter-DC link). ZPA can't make that leg shorter — only closer placement can.
The mtr spike is now on the last hop (connector → app), not at the ZEN.
mtr -rwzbc20 erp.tcs.local
HOST: conn-mum          Loss%  Snt   Avg  Best  Wrst
  1.|-- zen-mum.zscaler       0.0%   20   3.2   2.9   4.8   # ZEN is near ✓
  2.|-- inter-dc.link         0.0%   20  74.5  71.0  89.2   # slow WAN to SG
  3.|-- erp.sg.tcs.local      0.0%   20  76.1  73.4  91.0   # app in Singapore
Deploy an App Connector in the same region/DC as the app and map that connector group to the app's server group. Keep the connector-to-app hop short — that's the leg ZPA cannot accelerate.
A local connector now serves the app; mtr to the app drops to single-digit ms, and ZDX page-load times fall for users hitting that app.
A big Infosys campus has many users on one latency-sensitive app (voice/CAD/trading). Even the nearest Public Service Edge adds enough hairpin latency to annoy them — brokering happens out in the Zscaler cloud, not on-site.
Public Service Edges are shared and live in Zscaler data centres. For a dense site with strict latency needs, the round-trip to even a regional ZEN is the floor — and a Private Service Edge on-site removes that floor.
ZDX Cloud Path shows the bulk of latency sitting on the user→ZEN leg even after picking the closest public ZEN.
ping -c5 zen-mum.private.zscaler.com
5 packets transmitted, 5 received, 0% loss
rtt min/avg/max = 22.1/24.8/29.0 ms   # ~25 ms floor to the nearest public ZEN
Deploy a Private Service Edge inside the campus/DC and steer that site's users to it. Brokering now happens locally; the user→ZEN leg drops to LAN latency.
ZDX Cloud Path shows the site's users on the Private Service Edge; the user→ZEN leg falls from ~25 ms to ~1–2 ms, and the app feels native.
"Laggy app" tickets keep coming and the team keeps guessing. You need the evidence of which Service Edge a user actually used and where the latency lives — before you change anything.
Without ZPA Diagnostics + ZDX, "slow" is a feeling. The selected ZEN, the per-leg RTT, and the page-load breakdown are all visible in the portal — guessing wastes hours.
In the ZPA Admin Portal open Diagnostics for the user's session to see the selected Service Edge and connector. In ZDX → Cloud Path / Web Probes, read per-hop latency and page-load for that exact app. Then corroborate from the connector host.
mtr -rwzbc20 erp.tcs.local
ping -c4 erp.tcs.local
ZDX Cloud Path: user→ZEN 9ms · ZEN→conn 4ms · conn→app 2ms = 15ms ✓
mtr: no hop > 15 ms, 0% loss   # latency is healthy — look at MTU/capacity next
If a far ZEN or far connector shows up, fix per SCN-01/02/03. If latency is clean (like above), you've ruled out geo — move to Bucket 2 (MTU) or Bucket 3 (capacity). Naming the bucket is the fix here.
You can state, with ZDX evidence, which ZEN and connector served the session and where each millisecond went — and route the ticket to the right bucket instead of guessing.
Predict: a Bengaluru user's app lags ~160 ms on every click; the connector is idle and error-free. mtr from the connector shows the big jump appears at a hop named zen-fra.zscaler. What is happening, and what's the fix?
A Bengaluru user's ZPA app lags ~150 ms on every interaction; the connector is healthy and idle. mtr from the connector shows the latency jump appears at a hop named zen-fra.zscaler, and the app's own hop is < 2 ms. Best first action?
Bucket 2 — MTU, fragmentation & MSS
📍 Scenario. Rahul at TCS pings the file server over ZPA — perfect, 0% loss. He opens a web form — instant. Then he tries to copy a 2 GB build artefact, and it crawls to a stop at "1%." RDP to the same host freezes the moment the screen redraws. Small packets fly; big ones vanish. Classic MTU black-holing — the parcel too big for the letterbox.
The tell here is unmistakable once you know it: ping and small requests work, but large transfers, RDP, SMB and downloads stall or hang. The microtunnel is TLS-wrapped; if you also turn on Double Encryption, a second TLS layer goes on. Every wrapper steals usable MTU, and a packet with the DF bit set gets silently black-holed at the narrow hop. The fix is to size the payload to fit — clamp MSS or lower MTU — and drop Double Encryption if you don't need it.
Rahul's small requests and ping succeed, but a large file copy, an SMB share, or RDP redraw hangs and never completes. No errors in the app — it just stalls.
The path MTU is lower than the sender assumes. The TLS-wrapped microtunnel (and any overlay/VPN/cloud underlay on the connector's path) leaves less room than 1500 B, so full-size DF packets are dropped silently at the narrow hop.
Probe the path MTU from the connector host: send a Don't-Fragment packet and shrink the size until it passes. The payload size + 28 (IP+ICMP headers) = the MTU you're testing.
ping -M do -s 1472 10.30.10.20   # 1472 + 28 = 1500
ping -M do -s 1372 10.30.10.20   # 1372 + 28 = 1400
tracepath 10.30.10.20
ping -s 1472: ping: local error: message too long, mtu=1400
ping -s 1372: 1380 bytes from 10.30.10.20: icmp_seq=1 ttl=63 time=1.9 ms
tracepath:   2:  10.30.0.1      0.6ms pmtu 1400   # this hop lowered the MTU
Size traffic to the real path MTU: clamp MSS on the connector's gateway (e.g. --set-mss 1360 for a 1400 MTU path) or lower the connector NIC MTU. MSS clamping is preferred — it fixes TCP without breaking PMTUD for everything else.
# on the connector's L3 gateway / host firewall:
iptables -t mangle -A FORWARD -p tcp --tcp-flags SYN,RST SYN \
  -j TCPMSS --clamp-mss-to-pmtu
# or pin it explicitly:  -j TCPMSS --set-mss 1360
ping -M do -s 1372 10.30.10.20 succeeds, the 2 GB copy completes at full rate, and RDP stops freezing on redraw.
An app segment is noticeably slower than its neighbours on the same connector, and connectors serving it run hotter and report less health-check headroom — even though latency to the ZEN is fine.
Double Encryption is enabled on that segment. It adds a second TLS layer — more CPU per packet, ~40 B more MTU tax, and it roughly halves the connector's health-check headroom. Unless a compliance mandate requires it, it's pure overhead.
Check the segment's Double Encryption setting in the portal, and watch per-packet CPU on the connector while the slow segment is in use.
top -b -n1 | grep zpa-connector
ss -tn state established | wc -l   # active sessions on this connector
2041 zscaler  ... zpa-connector  61.0 %CPU   # high for the session count
# Portal: App Segment "Build-Farm" → Double Encryption = ENABLED
In Application Segments, disable Double Encryption for that segment unless a specific policy requires the second TLS layer. The microtunnel is already TLS-encrypted end to end — the second layer is redundant for most apps.
Per-packet CPU drops, the segment's throughput rises, usable MTU recovers ~40 B, and the connector's health-check headroom roughly doubles back.
The connector runs in a cloud VPC or behind an IPsec/SD-WAN overlay. Some apps are flawless; one app that pushes big frames intermittently hangs — and only for users whose path crosses the overlay.
The overlay/underlay (GENEVE/VXLAN/IPsec) lowers the effective MTU on that leg. PMTUD relies on ICMP "fragmentation needed" coming back — but many clouds/firewalls drop that ICMP, so the sender never learns and keeps black-holing.
tracepath names the hop that drops the MTU; confirm the ICMP "needed" message isn't being filtered.
tracepath 10.30.10.20
ping -M do -s 1422 10.30.10.20   # test the suspected overlay MTU (1450)
 1:  10.30.0.1        0.5ms
 2:  vpc-overlay-gw   0.9ms pmtu 1450   # overlay drops MTU to 1450
ping -s 1422: ... 0% packet loss   # 1450 passes; 1500 was black-holed
Clamp MSS to the overlay MTU (e.g. --set-mss 1410 for a 1450 path), and allow ICMP type 3 code 4 ("fragmentation needed") through the firewalls so PMTUD can work for the rest. Lowering the connector NIC MTU to the overlay value is the blunt fallback.
ping -M do passes at the overlay MTU, the intermittent hang disappears for overlay-path users, and big frames complete.
You lowered MTU / clamped MSS and "it seems fine now" — but you can't prove the black-hole is gone, and it sometimes comes back after a network change.
"Seems fine" isn't a test. The only deterministic proof is a Don't-Fragment ping at the corrected size succeeding, plus a real large transfer completing — not a casual click that happens to use small packets.
Run the DF ping at the size your clamp/MTU allows, then drive real bulk traffic and watch it finish.
ping -M do -s 1400 10.30.10.20   # NOTE: tests 1428 MTU; use a size ≤ path MTU − 28
ping -M do -s 1372 10.30.10.20   # 1400-MTU path: this must pass
# then drive real bulk traffic:
scp bigfile.iso user@10.30.10.20:/tmp/
ping -s 1372: 5 packets transmitted, 5 received, 0% packet loss
bigfile.iso  100%  2048MB  112.4MB/s   00:18   # completes at line rate
If the DF ping at the corrected size still fails, your clamp/MTU is still too high for the real path — lower it to the value tracepath reported and re-test. Bake the clamp into config so a network change can't silently undo it.
ping -M do -s 1372 10.30.10.20 succeeds with 0% loss and a multi-GB transfer completes at line rate — your proof the black-hole is gone.
Predict: an app over ZPA passes ping perfectly and small pages load instantly, but RDP freezes on screen redraw and a 2 GB copy stalls at 1%. The connector is healthy and the ZEN is near. Which one property of the path is wrong — and how do you prove it in one command?
ping -M do -s 1472 <app> fails with "message too long, mtu=1400" while -s 1372 passes. Fix = clamp MSS / lower MTU to the real path value.From a connector host, ping -M do -s 1472 10.30.10.20 returns "message too long, mtu=1400", while ping -M do -s 1372 10.30.10.20 succeeds. Users report large file copies and RDP hang, but small pages work. Best fix?
Bucket 3 — App Connector capacity & brownouts
📍 Scenario. Aditya at HCL gets the same complaint every evening: "the apps go slow around 6 PM and recover by 8." All day it's perfect. Geo is near, MTU is clean. It's a time-of-day pattern — the signature of a connector running out of headroom at peak. One small VM is carrying the whole site.
The tell for this bucket is slow or intermittent only at peak — never all day. Causes: the connector host's CPU/memory/conntrack table saturates, the Connector Group has too few members, or the connector's ~6,000 concurrent health-check ceiling is blown by wildcard-FQDN, wide-port app segments. The decision tree below routes the whole blog — print it.
Aditya's apps are perfect all day and crawl at ~6 PM. Sessions stall or new connections fail to open during the busy window, then recover on their own when load drops.
The connector host is at its limit during peak: CPU pinned, or the kernel conntrack table is full so new flows are dropped. Minimum spec is 2 vCPU / 4 GB RAM — a single under-provisioned connector for a busy site browns out at peak.
Capture load and socket/conntrack state during the slow window, not after.
top -b -n1 | head -8
ss -s
cat /proc/sys/net/netfilter/nf_conntrack_count /proc/sys/net/netfilter/nf_conntrack_max
%Cpu(s): 95.8 us  load average: 8.1, 7.6, 6.9
Total: 64210 (estab 61880)            # ~62k sockets
261888 / 262144                       # conntrack 99.9% full — new flows dropped
Add connectors to the Connector Group (the cloud load-balances across healthy members) and/or right-size the VM up. As a stopgap, raise nf_conntrack_max, but the real fix is more capacity, not a bigger table.
Per-connector peak CPU stays below ~70%, conntrack sits well under max, and the 6 PM brownout disappears — load now spreads across the group.
A site grew, user count doubled, but the Connector Group still has one (or one busy) member. Peak performance degraded gradually as adoption climbed — no single event to point at.
The Connector Group is undersized for the offered load. ZPA load-balances across healthy members of the same group — with one member, there's nothing to balance, so peak load lands entirely on it.
Check the group's member count and per-member utilisation in the portal; corroborate with host load. One hot member next to idle headroom elsewhere is the tell.
uptime
ss -tn state established | wc -l   # active sessions this member carries
conn-mum01: load average 7.9   sessions 58921   # the only member
# Portal: Connector Group "Mumbai-DC" → 1 connector, util 92%
Add one or more App Connectors to the same Connector Group (deploy in pairs minimum). The cloud immediately starts spreading new sessions across all healthy members — capacity scales horizontally.
The portal shows ≥ 2 members sharing the load, per-member sessions and CPU roughly halve, and peak-hour performance recovers.
A connector group is healthy and not CPU-bound, yet some apps intermittently look slow or "unhealthy." It started after someone added a broad *.tcs.local segment with a wide port range.
Each App Connector continuously health-checks the destinations it serves, and there's a practical per-connector ceiling (~6,000 concurrent checks). A wildcard FQDN × wide port-range segment explodes the destination count and blows past it — starving real traffic of health-check slots.
Audit the segments mapped to the group: count distinct FQDNs × ports. Wildcards over big subnets with 1-65535 ranges are the usual culprit.
# Portal: Application Segments → for this connector group
# count = (resolved FQDNs) × (ports in range)
sudo journalctl -u zpa-connector | grep -i -E "health|probe|limit"
Segment "ALL-DC": *.tcs.local : 1-65535
zpa-connector[2510]: health-check targets 8120 > soft limit 6000
zpa-connector[2510]: deferring probes — capacity exceeded
Narrow the segments: replace the wildcard with specific FQDNs/subnets and the wide range with the actual ports the apps use. Split one mega-segment into several scoped ones across more connectors. The health-check count falls back under the ceiling.
The log no longer reports exceeding the health-check limit, intermittent "unhealthy" flips stop, and probes run on time again.
Even off-peak the connector sits at high baseline CPU, and adding members only delays the brownout. The host itself is simply too small for the sustained throughput this site needs.
The VM is at or below the minimum (2 vCPU / 4 GB). High-throughput sites (lots of bulk transfer, many concurrent sessions) need more vCPU/RAM per connector — horizontal scaling helps, but undersized hosts cap each member's ceiling.
Look at the steady-state (not just peak) baseline and the throughput per vCPU.
nproc; free -m
sar -u 1 5    # steady-state CPU over a quiet window
2            # only 2 vCPU
Mem: total 3902 used 3100
Average:  %user 68.4  %idle 27.1   # 68% busy even at idle hours
Resize the connector VM up (e.g. 2→4 vCPU, 4→8 GB) per the sizing guidance for the throughput, and keep ≥ 2 members per group. Right-size + scale out together — neither alone is enough for a heavy site.
Steady-state CPU drops to a comfortable baseline (< 50%), peak headroom returns, and the brownout doesn't recur as adoption keeps growing.
An app is fast all day and slow only at ~6 PM, recovering on its own by 8 PM. Geo and MTU both check out. During the slow window, ss -s shows ~62k established sockets and conntrack is 99.9% full on the single connector. Best fix?
Bucket 4 — Slow DNS / TLS setup & using ZDX as the RCA tool
📍 Scenario. Sneha says the ERP app "takes 4 seconds to open, then it's perfectly fast." Re-opening tabs is instant. Only the first connect drags. That's not bandwidth or distance — it's the one-time setup cost: a slow resolver or a sluggish TLS handshake at the connector, before the session is warm.
The tell for this bucket is first connect slow, the rest fine. The connector resolves app FQDNs itself, so a slow or failing-over resolver delays every fresh session; a sluggish TLS setup or renegotiation does the same. And when you've run out of guesses, ZDX Cloud Path is the end-to-end RCA tool — it plots the whole journey (ZCC → ZEN → connector → app, plus page-load) so you can see which leg owns the delay instead of inferring it.
The first time a user opens an app it takes several seconds; subsequent connections are instant. The app itself is fast once it's up — only the opening lag is the complaint.
The connector resolves app FQDNs itself, so a slow internal resolver (overloaded, or a primary that times out before the cache falls to a secondary) adds seconds to every cold session. Once the answer is cached, it's fast.
Time the resolution from the connector host and read dig's Query time.
dig @10.10.0.53 erp.tcs.local
dig @10.10.0.53 erp.tcs.local | grep "Query time"
;; Query time: 2412 msec       # 2.4 s — explains the cold-connect lag
;; SERVER: 10.10.0.53#53(10.10.0.53)
# a healthy resolver answers in < 20 ms
Point the connector at a fast, reachable internal resolver; add a healthy secondary so a slow primary doesn't have to time out first. Fix the resolver's own load if it's overwhelmed. Keep the app zone resolvable locally to the connector.
dig Query time drops to < 20 ms, and the first-connect lag disappears — opening the app is now as fast as re-opening it.
DNS is fast, geo is near, MTU is clean — but new sessions still take a beat to "warm up." Long-lived sessions feel fine; anything that opens a fresh connection pays a small but consistent setup tax.
TLS handshake/renegotiation cost on the microtunnel and/or the app's own TLS. If the app forces frequent renegotiation, or the connector is doing extra crypto (e.g. Double Encryption, SCN-06), every new flow carries the handshake latency.
Time the TLS handshake to the app from the connector and compare connect time vs total time.
curl -sk -o /dev/null -w 'connect:%{time_connect} tls:%{time_appconnect}\n' \
https://erp.tcs.local:8443/connect:0.004 tls:1.180 # TCP is 4 ms; the TLS handshake costs 1.18 s # a healthy handshake is well under 200 ms
Remove unnecessary crypto load — disable Double Encryption if not required (SCN-06) — and address app-side TLS (avoid forced renegotiation, enable session resumption). Right-size the connector if crypto is CPU-bound.
time_appconnect falls to < 200 ms, and users stop noticing the per-session warm-up — fresh connections feel as quick as warm ones.
An app is slow for one region of users and you can't tell which leg owns the delay — the user's last mile, the ZEN, the connector, or the app. Per-host tools only see their slice of the path.
No single command on the connector sees the user→ZEN leg, and nothing on the client sees the connector→app leg. Without an end-to-end view you keep fixing the wrong leg. ZDX Cloud Path is the one tool that spans the whole journey.
In ZDX → Cloud Path for the affected app, read per-hop latency and page-load for the real user; the ZDX Score and stage breakdown name the slow leg. Corroborate the connector→app leg from the host.
mtr -rwzbc20 erp.tcs.local
curl -sk -o /dev/null -w 'dns:%{time_namelookup} ttfb:%{time_starttransfer}\n' \
https://erp.tcs.local:8443/ZDX Cloud Path: user→ZEN 96ms ⚠ · ZEN→conn 5ms · conn→app 2ms # 96 ms on the user's last mile, NOT ZPA — it's the user's home/ISP link
Fix the leg ZDX names — and only that leg. User→ZEN high = geo/last-mile (SCN-01..04); ZEN→connector or connector→app high = placement/MTU/capacity (Buckets 1–3); first-hit spikes = DNS/TLS (SCN-13/14). ZDX turns guessing into routing.
After the targeted fix, the ZDX Score recovers and the previously-red leg in Cloud Path drops to normal — proven end-to-end, not just "feels better."
An internal app is inconsistently slow or routes oddly — sometimes via ZPA, sometimes via ZIA or the public internet. The same FQDN behaves differently depending on the user's PAC/forwarding state.
The FQDN is claimed by both a ZPA Application Segment and a ZIA forwarding/PAC rule — a split-DNS / wrong-lane overlap. Traffic that should ride the private ZPA path leaks to ZIA, adding internet-path latency and unpredictability.
Confirm which lane the FQDN resolves/forwards into from a client, and check for the same domain in both ZPA segments and ZIA PAC/forwarding.
dig +short erp.tcs.local         # public answer? then it's leaking to the internet
# Check: ZPA App Segments AND ZIA PAC/forwarding both list erp.tcs.local
203.0.113.40      # a PUBLIC IP — should resolve to the private 10.30.9.40
# overlap: ZPA segment + ZIA PAC both claim erp.tcs.local
Make the FQDN owned by exactly one lane: keep the internal app in the ZPA Application Segment and remove it from ZIA forwarding/PAC (or vice-versa). One FQDN, one path — no ambiguity.
The FQDN consistently resolves to the private IP and routes via ZPA for all users; ZDX shows a stable path, and the intermittent slowness/odd routing stops.
Predict: an app is slow for your home-working users only. ZDX Cloud Path shows 96 ms sitting on the user→ZEN leg, while ZEN→connector and connector→app are both single-digit ms. Where is the problem — and what should you NOT do?
A user reports the ERP app "takes 4 seconds to open, then it's fast; re-opening is instant." Geo, MTU and capacity all check out. From the connector, dig @10.10.0.53 erp.tcs.local reports Query time: 2412 msec. Best fix?
dig Query time is a slow-resolver signature — the connector resolves app FQDNs itself, so a sluggish resolver taxes every cold session. Capacity (a), MTU (b) and geo (d) are the wrong buckets; fix the resolver.🤖 Ask the ZPA Performance Tutor
Tap any question — instant, scoped to this lesson. The kind of thing you'd ask after reading.
Pre-curated from Zscaler docs + community threads. For deeper/live questions, paste your log into chat.techclick.in.
In two lines: why do ping and small pages work while big transfers and RDP hang? Type your answer first — then reveal the expert version and compare.
Tap to generate a one-liner you can paste to a teammate who's stuck on a slow ZPA app.
mtr + ZDX Cloud Path). Ping fine but big transfers hang = MTU black-holing (ping -M do -s 1472 app, then clamp MSS). Slow only at peak = connector capacity (top/ss -s, add connectors). First connect slow = slow DNS/TLS (dig Query time). Measure the leg before you change the knob. — learned this on ai.techclick.in"📖 Glossary
- MTU
- Maximum Transmission Unit — the largest packet a path can carry (1500 B on standard Ethernet). The ZPA microtunnel's wrappers leave less room, so oversized packets must be sized down or they're dropped.
- MSS
- Maximum Segment Size — the largest TCP payload per packet. "MSS clamping" lowers it so a TCP segment + all headers/wrappers fits the real path MTU, the cleanest MTU fix.
- Path MTU black-holing
- When an oversized packet with the Don't-Fragment (DF) bit set is silently dropped at a narrow hop. Ping and small requests work; big transfers/RDP/SMB just hang.
- Microtunnel
- The encrypted (TLS) tunnel ZPA builds for a brokered session. Each encryption layer adds overhead and steals usable MTU.
- Double Encryption
- An optional ZPA setting that adds a second TLS layer to the microtunnel — extra CPU + ~40 B more MTU tax + halved health-check headroom. Disable it unless a mandate requires it.
- Service Edge (ZEN)
- The Zscaler cloud node that brokers the session. A user brokered through a distant ZEN feels laggy on every round trip — geography is the latency.
- Private Service Edge
- A Service Edge you run on your own infrastructure near users, so brokering happens locally instead of in the Zscaler cloud — removes the user→ZEN latency floor.
- Connector group
- A set of App Connectors the cloud load-balances across. Add members to a saturated group to cure peak-hour brownouts; deploy ≥2 per location.
- ZDX Cloud Path
- Zscaler Digital Experience's hop-by-hop view of the whole journey (ZCC → ZEN → connector → app) plus page-load — the end-to-end RCA tool that names which leg owns the delay.
🎓 Prove it — 10-question assessment
Q1–Q4 above already count. Answer Q5–Q10 below, then Submit. Pass = 70% (7/10). Passing marks this performance lesson complete on your profile.
📚 Sources
- Zscaler Help — ZPA Performance & Latency Troubleshooting and Understanding the Service Edge / broker selection. help.zscaler.com/zpa
- Zscaler Help — About App Connectors: sizing, capacity & health checks and App Connector Groups. help.zscaler.com/zpa
- Zscaler Help — Configuring Double Encryption for Application Segments (overhead & when to use). help.zscaler.com/zpa
- Zscaler Help — Private Service Edge: deployment & on-prem brokering. help.zscaler.com/zpa
- Zscaler ZDX — About Cloud Path and Analyzing the network path / ZDX Score (per-hop latency, page-load). help.zscaler.com/zdx
- Zscaler Community (Zenith) — threads on ZPA MTU / fragmentation, large transfers hanging, MSS clamping. community.zscaler.com
- RFC 1191 (Path MTU Discovery) & RFC 4459 (MTU/fragmentation issues in tunnels); Linux
ping -M do/tracepath/iptables TCPMSSman pages. - Zscaler Academy — ZDTA Certification blueprint (Service Edges, App Connectors, ZDX). zscaler.com/zscaler-cyber-academy
What's next?
You can now tell a far-ZEN lag from an MTU black-hole from a peak-hour brownout. For the "it's not even green" side — enrollment, broker connectivity and connector health — read the App Connector troubleshooting lesson; for the full method, see the troubleshooting playbook hub.
— Techclick Team