Start here · understand the lesson before the detail
What you are learning
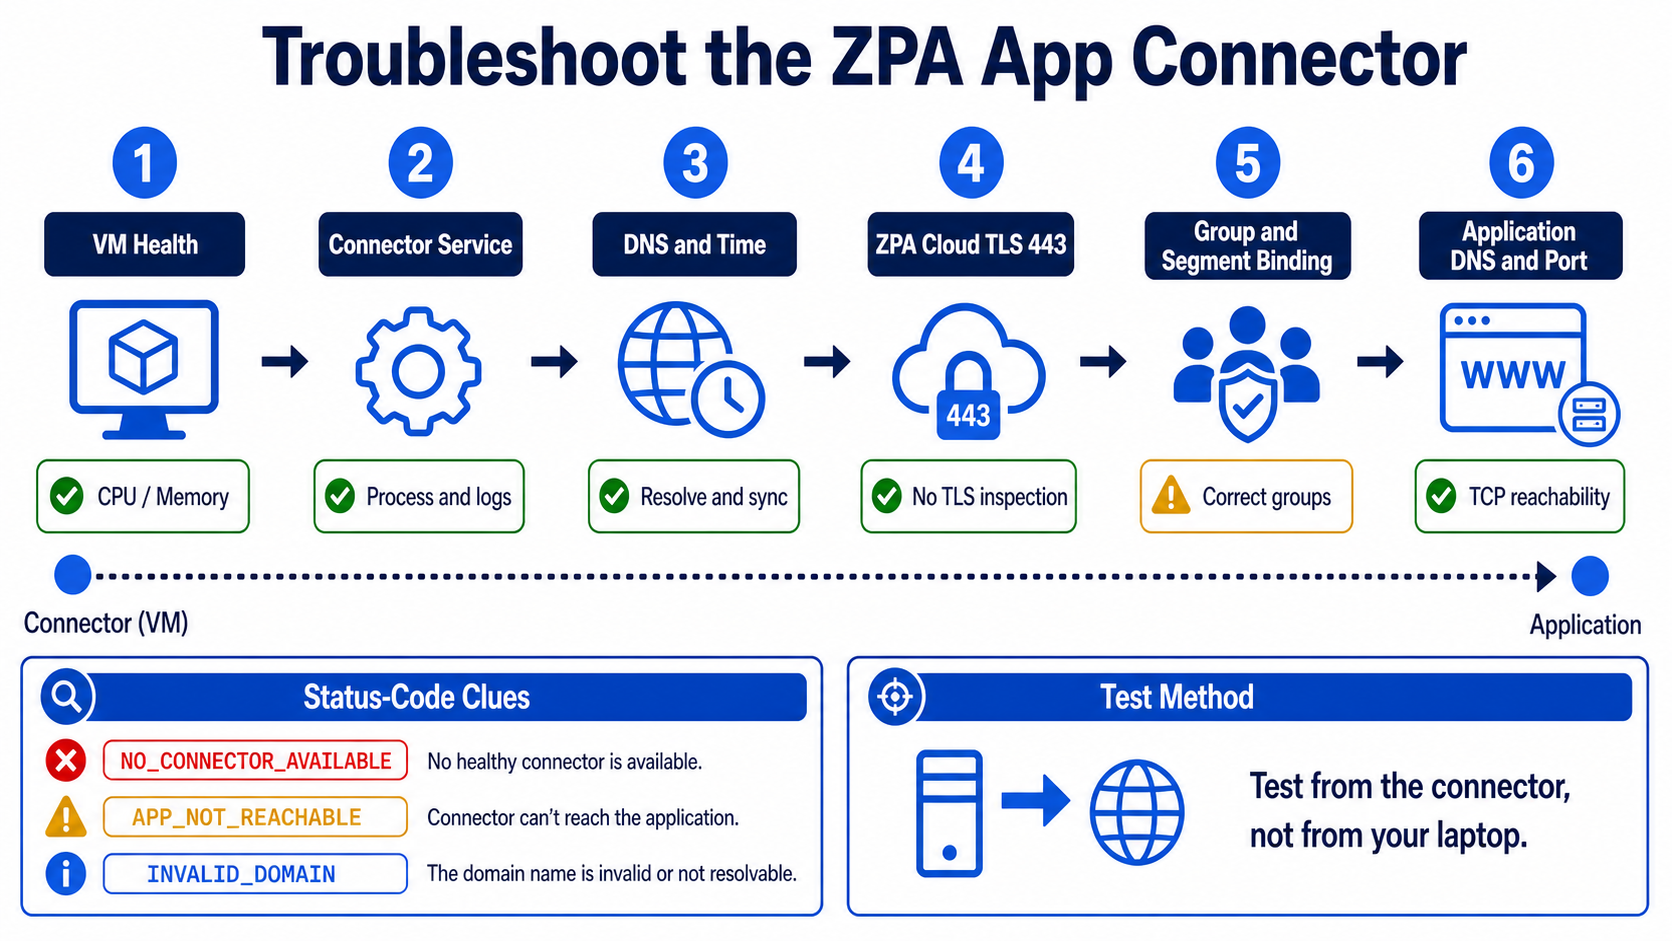
This lesson helps you troubleshoot the App Connector from the connector outward. You will separate VM health, connector service, ZPA cloud connectivity, configuration binding, and private application reachability.
In plain English
A connector can appear green yet fail one application. Cloud health proves only part of the path. The connector must also resolve the private name, open the defined application port, belong to the correct group, and avoid TLS interception on its ZPA cloud connection.
Real example
Users receive APP_NOT_REACHABLE. The connector is online, but from its own network the payroll name resolves to an old IP and TCP 443 fails. Fixing Client Connector or access policy would not repair that server-side DNS and port failure.
Follow this flow
- Check VM resources, clock, connector service, and local logs.
- Resolve ZPA cloud endpoints and test outbound TLS 443 without interception.
- Confirm connector ID, group, version, certificate, and health.
- Trace connector-group to server-group to application-segment binding.
- Resolve the private app and test its exact port from the connector network.
Evidence to collect
- CPU, memory, disk, service, restart, and log timestamps
- ZPA endpoint DNS and TLS certificate result
- Connector ID, status code, group, and Service Edge
- Private DNS, route, TCP result, health probe, and packet capture
Common mistake to avoid
Do not test only from an administrator laptop. The App Connector’s DNS, route, firewall, and source network are what matter. Avoid deleting or re-enrolling a connector until the identity and recovery consequences are understood.
Current official source checkpoint
- Troubleshooting App Connectorscurrent official reference used for this beginner explanation
- App Connector runbookcurrent official reference used for this beginner explanation
Key terms before you continue
The belief that costs you four hours
Most engineers see "Disconnected" in the ZPA portal and assume the network is down. Wrong — and that wrong instinct is exactly why a 5-minute fix turns into a half-day outage. A connector can show Disconnected because its clock drifted by 6 minutes, because a VM was cloned and its hardware fingerprint changed, or because someone enabled SSL inspection on the firewall last night. The network is fine. The identity or the trust broke.
So the senior move is never "is the network up?". It's "which hop in the path broke, and what does that specific hop's log say?" This blog teaches you the path first, then walks all 16 failure scenarios that live along it.
No scoring. Just notice which ones you can't answer yet — those are the sections to slow down on. We answer all three as you scroll.
- The connector shows Disconnected but you can SSH into the box and ping the internet. What single thing do you check first?
- Which one firewall change, done with good intentions, silently kills every App Connector tunnel?
- The connector is green and healthy, but users get "app not reachable". Whose problem is it — the connector's, or the config's?
The big picture — where the App Connector sits
The ZPA App Connector is a lightweight Linux daemon you run next to your private apps — in your data centre, your VPC, your branch. It dials outbound only to the Zscaler cloud — specifically a broker — and stitches together two halves of a connection: the user's side (handled by ZCC) and the app's side. The user never routes to your network; the connector reaches out to meet the cloud. That's the whole trick — and the whole troubleshooting map.
Your diagnostic toolbox — tap each card
These six are the commands and files you'll reach for in every scenario below. Memorise the front of each card; the back tells you what it proves.
Is the daemon even running? Shows active (running) or a crash reason. Your first command on every ticket — before you touch the portal.
The truth source. Shows connector ID, version, cert expiry, "Control connection state", and the broker it's talking to. Add -f to follow live.
The one-time enrollment token. If empty, malformed, or wrapped in smart-quotes, enrollment never starts. Plain double-quotes only.
Holds instance_id.crypt — the fingerprint-encrypted identity. Wipe this dir to force a clean re-enroll when the hardware ID changed.
TLS dies on clock drift. /etc/chrony.conf sets the NTP source. More than a few minutes of skew and cert validation fails — connector goes Disconnected.
The connector resolves both the broker and your apps. If the zscaler user can't read this file, enrollment and app lookups fail. So-what: a permission bit can break everything.
Watch the connector come online — and see where it breaks
Before the scenarios, run this once. Press Play and watch the six stages a connector walks from a cold boot to brokering a live session. Each scenario below maps to exactly one of these stages going red.
▶ App Connector bring-up — 6 stages
Press Play (auto-steps), or tap Next to walk it yourself. Stage 4 turns red — that's where a blocked 443 or time skew stops you cold.
zpa-connector daemon starts on the Linux host (10.20.5.11)./etc/resolv.conf, resolves the Zscaler broker FQDNs via DNS./opt/zscaler/var/provision_key and presents it to enroll.instance_id.crypt. Portal flips to Connected.Bucket 1 — Enrollment & onboarding failures
Symptoms here all share one trait: the connector never reaches Connected, or it was Connected and dropped to Disconnected and won't come back. The portal status lives at Configuration & Control → Private Infrastructure → App Connector Management → App Connectors. Your on-box truth source is always journalctl -u zpa-connector.
Aditya at Wipro deployed the VM, but the portal App Connectors page shows the connector grey/absent, or status Disconnected. It never turned green.
- Daemon not running (crashed or never started)
- No outbound 443 to the broker (Bucket 2)
- Provisioning key missing/empty
- DNS can't resolve the broker FQDNs
Start on the box, not the portal. Confirm the daemon, then read the log.
sudo systemctl status zpa-connector
sudo journalctl -u zpa-connector --since "15 min ago"
● zpa-connector.service - Zscaler App Connector
   Active: active (running) since Fri 2026-05-30 09:12:04 IST
   ...
zpa-connector[2041]: Connector ID 88121, version 24.x
zpa-connector[2041]: Control connection state: CONNECTED to broker
zpa-connector[2041]: Certificate valid until 2027-05-29
If Active: inactive (dead) → sudo systemctl start zpa-connector and enable it for boot. If the log shows TLS/connect errors, jump to Bucket 2. If it shows a key error, jump to SCN-03.
Log shows Control connection state: CONNECTED and the portal flips to a green Connected within ~60 seconds.
Brand-new connector, but the log loops on an enrollment/authorization rejection and the portal never shows the connector. The key may have hit its max-enrollment count or passed its expiry date.
- Key expired (keys carry an expiry)
- Key already used up to its max number of connectors
- Key copied with smart-quotes / trailing newline
- Key belongs to a different connector group
In the portal, open the key under App Connector Management → Provisioning Keys and check enrolled count < max and the expiry. On the box, eyeball the key file.
sudo cat /opt/zscaler/var/provision_key
sudo journalctl -u zpa-connector | grep -i -E "enroll|key|auth"
3|api.private.zscaler.com|hex... (one clean line, no curly quotes)
zpa-connector[2102]: enrollment rejected: provisioning key invalid/expired
zpa-connector[2102]: retrying enrollment in 30s
Generate or edit a valid key in the portal (raise max-count or extend expiry), then re-paste with plain double-quotes (U+0022):
sudo systemctl stop zpa-connector
echo "3|api.private.zscaler.com|VALID-KEY-HEX" | sudo tee /opt/zscaler/var/provision_key
sudo systemctl start zpa-connector
Log moves past enrollment to Control connection state: CONNECTED; the portal's key "enrolled" counter increments by one.
A previously-working connector goes Disconnected after a VM clone, MAC change, disk resize, or migration. The log shows "Cannot decrypt data from instance_id.crypt".
The fingerprint (hardware ID) is computed from MAC + VM info + disk info. If any of those change, the connector can no longer decrypt its sealed identity and can't prove who it is to the cloud.
sudo journalctl -u zpa-connector | grep -i "instance_id.crypt"
zpa-connector[1980]: ERROR Cannot decrypt data from instance_id.crypt
zpa-connector[1980]: fingerprint mismatch — host identity changed
zpa-connector[1980]: enrollment required
Wipe the stale instance data and re-enroll with a fresh/reusable key. The old connector entry in the portal can be deleted.
sudo systemctl stop zpa-connector
sudo rm -f /opt/zscaler/var/instance_id.crypt /opt/zscaler/var/*.crypt
echo "3|api.private.zscaler.com|REUSABLE-KEY" | sudo tee /opt/zscaler/var/provision_key
sudo systemctl start zpa-connector
A new connector object appears in the portal as Connected. Pin the VM's MAC address so this never recurs after a reboot or vMotion.
The connector starts but never enrolls. The log shows name-resolution failures for the Zscaler broker FQDNs — even though the host itself seems to have internet.
- The
zscalerservice account can't read/etc/resolv.conf(wrong permission bit) - No nameserver configured, or it's an internal-only resolver that can't reach Zscaler FQDNs
ls -l /etc/resolv.conf
sudo -u zscaler nslookup api.private.zscaler.com
-rw------- 1 root root 88 May 30 /etc/resolv.conf   # zscaler user can't read
;; connection timed out; no servers could be reached
Grant the zscaler user read access and ensure a working resolver is set.
sudo chmod 644 /etc/resolv.conf
sudo systemctl restart zpa-connector
sudo -u zscaler nslookup api.private.zscaler.com returns an answer, and the log proceeds to enroll.
Predict: the connector is Disconnected, daemon is running, and journalctl shows TLS handshake timeouts to the broker. The host can browse the internet fine. What's the single most likely cause?
Priya at Infosys clones a working App Connector VM to spin up a second one. The clone shows Disconnected and the log says "Cannot decrypt data from instance_id.crypt". What happened?
instance_id.crypt but has a different hardware identity, so decryption fails. Never clone an enrolled connector — wipe /opt/zscaler/var/ and re-enroll, or build from a clean image.Bucket 2 — The tunnel to the cloud
Enrollment can be perfect and the connector still won't connect, because the control connection rides outbound TCP 443 to the Zscaler broker. Anything that blocks, intercepts, or mis-routes that 443 stream lands here. This is the bucket that answers pre-quiz Q2 — and it's the one engineers misdiagnose most, because the host "has internet".
Connector Disconnected; log shows the TLS dial to the broker timing out or being refused. General web browsing from the host works, which throws people off.
The corporate firewall/egress filter doesn't allow outbound 443 to the Zscaler broker FQDNs. The connector needs only outbound 443 — no inbound ports — but it must reach the specific Zscaler destinations.
Test the exact path the connector uses. The broker list is published at ips.zscaler.net/zpa.
curl -sv -m 8 https://api.private.zscaler.com 2>&1 | head
sudo journalctl -u zpa-connector | grep -i -E "broker|connect|timeout"
*   Trying 165.225.x.x:443...
* connect to 165.225.x.x port 443 failed: Connection timed out
zpa-connector[2210]: broker connect failed: no route / timeout
Allowlist outbound TCP 443 from the connector's IP (e.g. 10.20.5.11) to the Zscaler ZPA destination ranges/FQDNs from ips.zscaler.net/zpa. No inbound rules needed.
curl -v to the broker completes the TCP+TLS, and the connector log reports Control connection state: CONNECTED.
443 is open, but the connector still won't connect — and the log shows a certificate/TLS validation failure. Often appears right after the firewall team enables decryption on the egress segment.
ZPA uses TLS with certificate pinning. An SSL-inspection device decrypts and re-signs with its own CA — which the connector rejects, because the pinned cert no longer matches.
echo | openssl s_client -connect api.private.zscaler.com:443 2>/dev/null \
  | openssl x509 -noout -issuer
issuer=CN = Corporate-SSL-Inspection-CA, O = TCS-Proxy
# Should be a Zscaler issuer. A corporate CA here = you're being decrypted.
Add the Zscaler ZPA domains/IPs to the SSL-inspection bypass/do-not-decrypt list on the firewall or proxy. ZPA traffic must pass through un-inspected.
The openssl issuer now shows a Zscaler CA, the TLS validation error clears, and the connector goes Connected.
The data centre forces all outbound through an explicit proxy. The connector can't dial the broker directly, so it never connects — even with 443 "allowed" on the proxy.
The connector has no proxy configured, so it tries a direct outbound that the network drops. It needs to be told to use the proxy with HTTP CONNECT.
Confirm there's no direct path and that a proxy is mandatory on this segment, then check for the proxy file.
ls -l /opt/zscaler/var/proxy 2>/dev/null || echo "no proxy file set"
curl -sv -m 8 https://api.private.zscaler.com 2>&1 | head -3
no proxy file set
*   Trying ...:443...
* connect ... failed: Connection timed out   # direct egress is blocked
Create /opt/zscaler/var/proxy with <proxy-host>:<port>. This only proxies connector↔broker traffic — not connector↔app traffic.
echo "10.20.1.8:8080" | sudo tee /opt/zscaler/var/proxy
sudo systemctl restart zpa-connector
The connector now reaches the broker via CONNECT through 10.20.1.8:8080; log shows CONNECTED. Proxy access logs show the connector's CONNECT requests.
The connector is Connected but app sessions feel slow, or the connector keeps re-selecting brokers. A Mumbai-hosted app is being brokered through a far-away Service Edge.
The connector reaches a sub-optimal Service Edge because closer broker FQDNs/ranges are blocked by the firewall, forcing it onto distant ones — adding latency on every brokered session.
sudo journalctl -u zpa-connector | grep -i -E "broker|service edge|latency"
zpa-connector[2301]: connected to broker (region: us-west)  # app is in ap-south
zpa-connector[2301]: control latency 210 ms
Allowlist the full ZPA destination set from ips.zscaler.net/zpa (not just one region) so the connector can pick the nearest Service Edge. Confirm the connector's deployment region is correct.
Log shows a nearby region and control latency drops (e.g. 210 ms → < 40 ms). Users report apps feel snappy again.
Predict: the firewall team enabled "decrypt all outbound TLS for visibility" last night. This morning every App Connector in that data centre is Disconnected. Why — and what's the fix that keeps their visibility goal mostly intact?
A connector in a locked-down DC has no direct internet — everything goes via proxy 10.20.1.8:8080. Enrollment fails with connection timeouts. What's the correct fix?
/opt/zscaler/var/proxy (not system env vars). This proxies only connector↔broker traffic. The connector needs no inbound ports (a is wrong), and SSL-inspection on app servers is unrelated (d).Bucket 3 — Connector health
Now the connector enrolls and reaches the broker — but it's unhealthy: it flaps, it's slow, or it drifts. These are the "it was fine yesterday" tickets. The decision tree below is your triage map for the whole blog; print it.
Connector flaps between Connected and Disconnected, or won't connect at all, with TLS/certificate errors — despite open 443 and no inspection. Classic after a VM was suspended/resumed and its clock drifted.
TLS rejects certificates whose validity window doesn't match the local clock. A few minutes of skew is enough to fail the handshake. /etc/chrony.conf has no reachable NTP source.
chronyc tracking
timedatectl status
Reference ID    : 00000000 (unsynchronised)
System time     : 312.4 seconds slow of NTP time
Leap status     : Not synchronised
Point /etc/chrony.conf at a reachable NTP server (internal preferred, Zscaler pool as fallback), restart chrony, force a sync.
sudo systemctl restart chronyd
sudo chronyc makestep
sudo systemctl restart zpa-connector
chronyc tracking shows Leap status: Normal and sub-second offset; the cert error clears and the connector stays Connected.
Karthik at TCS reports private apps are slow or sessions drop at peak hours. The connector is Connected, but it's pinned at high CPU/RAM, or shows a memory leak over days.
One connector is carrying too much load (under-provisioned, or it's the only one for a busy segment). Minimum spec is 2 vCPU / 4 GB RAM — busy segments need more, or more connectors.
top -b -n1 | head -12
free -m
%Cpu(s): 96.3 us,  2.1 sy   load average: 7.8, 7.2, 6.9
Mem:  total 3902   used 3760   free 142   # 96% RAM used
2041 zscaler  ... zpa-connector  98.0 %CPU
Add a second connector to the same connector group (the cloud load-balances across healthy members), or resize the VM up. For suspected leaks, collect periodic memory reports for Zscaler Support.
Per-connector CPU drops below ~70%, app latency recovers, and the portal shows load spread across both connectors in the group.
A connector drops to Disconnected right after a scheduled auto-upgrade window, or the portal flags it as running an old version that won't re-register.
The in-place upgrade (SARGE) failed mid-flight — interrupted download, disk full, or a stale package state — leaving the service unable to start cleanly.
sudo journalctl -u zpa-connector | grep -i -E "version|upgrade|sarge"
df -h /opt
zpa-connector[2280]: upgrade (SARGE) failed: package verification error
zpa-connector[2280]: service start aborted
/dev/sda1   8.0G  8.0G   0    100%  /opt   # disk full
Free disk, update the package, reboot. If it still won't register cleanly, the supported path is to rebuild from the latest image and re-enroll (deploy in pairs so this never causes an outage).
sudo yum update -y
sudo reboot
# verify after boot:
sudo systemctl status zpa-connector
Portal shows the connector on a current version and Connected. The connector group still served traffic throughout because its HA peer stayed up.
The connector toggles Connected/Disconnected repeatedly, or an app shows healthy in continuous mode but goes "unreachable" in on-access mode (or vice-versa) — and the team argues about whether the connector is actually broken.
- Routing/MTU instability or periodic restarts cause real flapping
- Health-reporting mode mismatch: Continuous probes apps on a schedule; On Access only checks when a user connects — so "unhealthy" can simply mean "nobody has accessed it yet".
sudo journalctl -u zpa-connector | grep -i -E "restart|disconnect|reconnect" | tail
09:31:02 Control connection state: DISCONNECTED
09:31:40 Control connection state: CONNECTED
09:34:11 Control connection state: DISCONNECTED   # flapping ~every 3 min
For real flapping, stabilise the network path (see SCN-15 MTU) and check for a watchdog restarting the service. For false "unhealthy", confirm the app segment's health-reporting mode matches expectations — set Continuous if you want proactive status, accept that On Access reports only on demand.
The Connected state holds steady for > 30 min with no restart log lines; app health reflects the chosen mode's expected behaviour.
443 is open, no SSL inspection, DNS works — yet a connector keeps flapping with TLS certificate errors. chronyc tracking shows "312 seconds slow / unsynchronised". Root cause?
Bucket 4 — The last mile to the app
The connector is green and healthy. Users still get "app not reachable". This is pre-quiz Q3 — and the answer is almost always config, not connector. The connector is fine; what's between it and the app (DNS, the app-segment definition, MTU, or simply no connector covering that app) is not.
Healthy connector, but users can't reach hr.tcs.local. The connector resolves app FQDNs itself — if it can't, the session has nowhere to go.
The connector's resolver (/etc/resolv.conf) points at a DNS server that doesn't know the internal zone, or the app's record doesn't exist / points to the wrong IP.
Resolve the app's FQDN from the connector itself.
nslookup hr.tcs.local
dig +short hr.tcs.local
** server can't find hr.tcs.local: NXDOMAIN
# vs healthy:  hr.tcs.local  ->  10.20.9.40
Point the connector at an internal DNS server that can resolve the app zone (or add the missing record). For split-horizon apps, ensure it uses the internal view.
dig +short hr.tcs.local returns the correct internal IP (10.20.9.40) from the connector; users reach the app.
Connector healthy, DNS resolves, but a specific app times out — or works for some users and not others. The app may also see the user's real IP and reply asymmetrically (double-NAT / source-IP issue).
- Application Segment domain/port set doesn't actually match what the app uses (e.g. app on 8443, segment says 443)
- The segment's domain isn't mapped to the right connector group / server group
- Source-IP anchoring (SNAT) disabled, so the app replies directly and the return path is asymmetric behind a NAT
- App expects a specific cert/SNI the segment doesn't pass cleanly
In the portal, open Application Segments for the app and confirm domain + TCP/UDP port range + connector/server group mapping. From the connector, test the actual app socket.
nc -zv hr.tcs.local 8443
sudo journalctl -u zpa-connector | grep -i -E "segment|reachable|reset"
Connection to hr.tcs.local 8443 port [tcp] succeeded!
# but the App Segment only lists 443 -> users never hit 8443
Correct the segment's domain + port range to match the app, map it to the connector group covering that subnet, and enable source IP anchoring if the app sits behind a NAT so return traffic stays symmetric.
nc -zv on the exact app port succeeds from the connector, and the user's access log shows the session brokered and allowed end-to-end.
App connects but large transfers or file shares hang/stall; small requests work. Or a domain that should go via ZPA is being sent to ZIA (or the public internet) because of overlapping DNS/forwarding.
- MTU mismatch on the connector's path (often a tunnel/overlay) causing large packets to be dropped silently when DF is set
- Split-DNS overlap: the same FQDN is claimed by a ZPA app segment and a ZIA forwarding/PAC rule — traffic takes the wrong lane
ping -M do -s 1472 hr.tcs.local
ip link show eth0 | grep -i mtu
ping: local error: message too long, mtu=1400
# 1472+28 = 1500 fails; path MTU is actually 1400
Lower the connector NIC MTU to the path value (e.g. 1400) or enable MSS clamping on the gateway. For split-DNS overlap, make the FQDN owned by exactly one lane — keep the internal app in the ZPA app segment and remove it from ZIA forwarding/PAC.
ping -M do -s 1372 succeeds at the corrected size; large file transfers complete; the FQDN consistently resolves and routes via ZPA.
Users get an explicit "no healthy connector" error for an app, even though a connector exists in the tenant. The app segment has no healthy connector that can actually reach it.
- The only connector for that segment is Disconnected or unhealthy (single point of failure — no connector group with a healthy peer)
- The app segment / server group isn't mapped to any connector group that can route to the app's subnet
- All connectors in the group are over capacity and marked unhealthy
In the portal, open the app's Server Group → Connector Group mapping and confirm at least one member is Connected and reaches the app subnet.
nc -zv hr.tcs.local 8443
sudo journalctl -u zpa-connector | grep -i "no healthy"
zpa-connector[2400]: app request: no healthy connector for segment "HR-Portal"
# group has 1 member and it's Disconnected (or can't route to 10.20.9.0/24)
Bring the connector healthy (it's a left-branch problem — work SCN-01..12), and deploy connectors in pairs per location so one failure never means "no healthy connector". Confirm the server/connector group mapping covers the app's subnet.
The app segment shows ≥ 2 healthy connectors; the error stops; killing one connector no longer takes the app offline.
Predict: a single App Connector serves the HR app. It dies during a Sunday patch. Monday morning, every HR user sees "no healthy connector". The connector itself is the symptom — but what's the real design failure, and what stops this class of outage permanently?
Connector is Connected and healthy, DNS resolves the app, but users still can't reach it. From the connector, nc -zv hr.tcs.local 8443 succeeds — but the app's Application Segment lists only port 443. What's the fix?
🤖 Ask the App-Connector Tutor
Tap any question — instant, scoped to this lesson. The kind of thing you'd ask after reading.
Pre-curated from Zscaler docs + community threads. For deeper/live questions, paste your log into chat.techclick.in.
In two lines: why is "Disconnected" almost never a network-down problem? Type your answer first — then reveal the expert version and compare.
Tap to generate a one-liner you can paste to a teammate who's stuck on a Disconnected connector.
journalctl -u zpa-connector + chronyc tracking. 90% of the time it's clock skew, a blocked outbound 443, SSL inspection breaking the pinned cert, or a changed fingerprint — not the link. 'Disconnected' = cloud-side; 'app not reachable' with a green connector = config-side. — learned this on ai.techclick.in"📖 Glossary
- App Connector
- A lightweight Linux daemon (
zpa-connector) deployed next to your private apps that dials outbound to the Zscaler cloud and brokers user→app sessions. - ZPA
- Zscaler Private Access — connects users to private apps over the Zscaler cloud, no network-level VPN.
- ZCC (Client Connector)
- The agent on the user's device that forwards their traffic into the Zscaler cloud.
- Broker / Service Edge (ZEN)
- The Zscaler cloud node the App Connector dials out to on 443; it stitches the user side to the app side.
- Provisioning key
- The one-time enrollment token at
/opt/zscaler/var/provision_keythat authorises a connector to join the tenant. - Fingerprint (hardware ID)
- The connector's identity, computed from MAC + VM + disk info. Changing the hardware breaks decryption of
instance_id.crypt. - Application Segment
- The portal object defining which domains/ports an app uses; ZPA only brokers traffic the segment declares.
- Connector group
- A set of App Connectors the cloud load-balances across — deploy ≥2 so one failure isn't "no healthy connector".
- Certificate pinning
- ZPA expects a specific cert; any re-signed cert (from SSL inspection) is rejected — which is why inspection must bypass ZPA traffic.
🎓 Prove it — 10-question assessment
Q1–Q4 above already count. Answer Q5–Q10 below, then Submit. Pass = 70% (7/10). Passing marks this lesson complete on your profile.
📚 Sources
- Zscaler Help — Troubleshooting App Connectors & ZPA App Connector Troubleshooting Runbook. help.zscaler.com/zpa
- Zscaler Help — About / Accessing App Connector Status Diagnostics & Managing Deployed App Connectors. help.zscaler.com/zpa
- Zscaler Help — App Connector Deployment Prerequisites & About App Connector Provisioning Keys. help.zscaler.com/zpa
- Zscaler Help Centre — ZPA App Connector: Cannot decrypt data from instance_id.crypt. zscaler.az-ap.com/article/15
- Zscaler Community (Zenith) — App Connector disconnected after a failed SARGE update & ZPA connector not starting. community.zscaler.com
- Zscaler Config — Zscaler Private Access Firewall Allowlist (broker destinations / ips.zscaler.net/zpa). config.zscaler.com/private.zscaler.com/zpa
- N. Catania — Deploying ZPA ZEN Connectors (CLI, file paths, NTP/DNS, proxy). nathancatania.com
- Zscaler Academy — ZDTA Certification blueprint (App Connectors, provisioning keys, deploying connectors). zscaler.com/zscaler-cyber-academy
What's next?
You can find a broken connector. Next: build the App Segments and access policies on top of it — domain sets, server groups, and the policy order that decides who reaches which private app.
— Techclick Team