Search index=_internal answers “is this search head even indexing its own logs?” index=* answers “do any non-internal indexes have events in this window?” Settings → Indexes / latest(_time) answers “when did this index last see an event?” sourcetype answers “which kind of data is missing?” Monitoring Console → Indexing answers “is the indexer actually writing?” Forwarders: Deployment → Status answers “is this forwarder active or missing?” Incident Review (if ES is present) answers “does this notable have an owner, status, and urgency?” An empty Events tab is not an outage. A green dashboard tile is not a last event time.
1. Why “is Splunk working?” is five questions
Operators collapse five failures into one sentence. The search head cannot search. User data never landed. One host’s sourcetype went silent. The indexer is delayed. A high notable sits Unassigned. Those are five first clicks.
This page is the night-shift desk for proof. The factory taught the sentence: index + time + count. Here you learn the six surfaces you actually open, in order, when someone asks you to prove Splunk is working — and why there are no events.
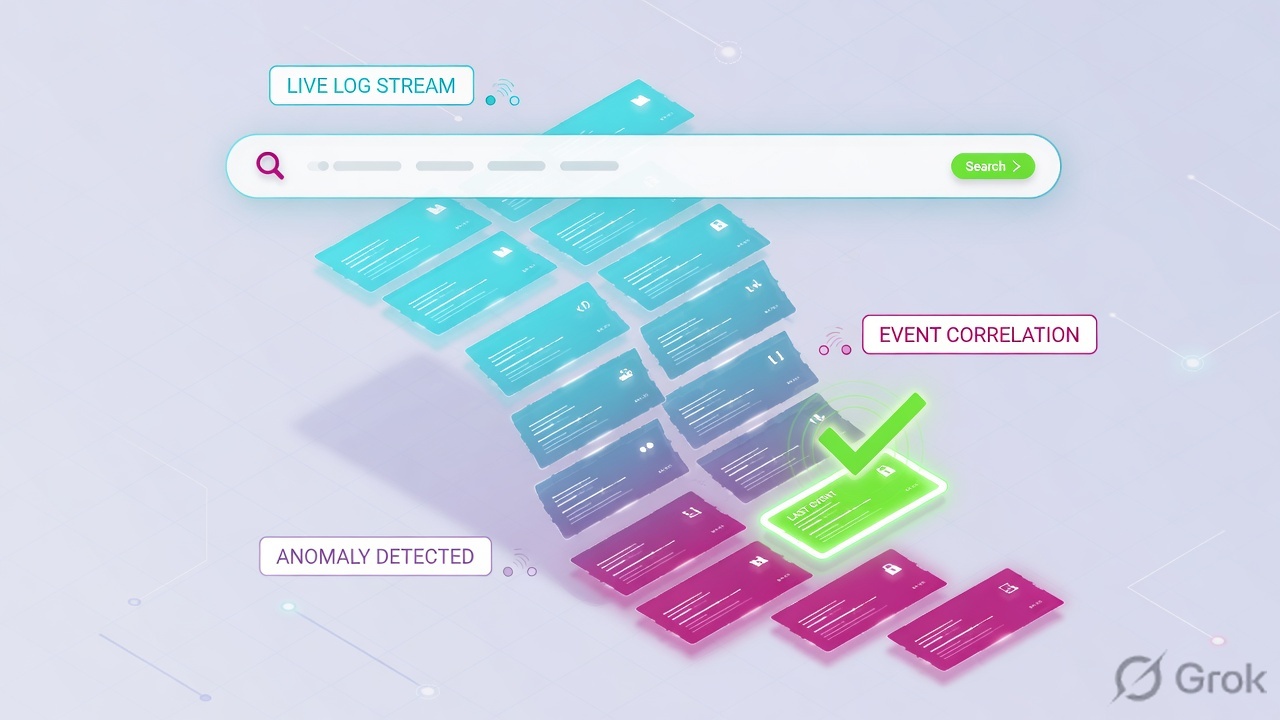
If they say “prove Splunk is working,” do not say “I opened a dashboard.” Say: “I prove the search head with index=_internal event count and last _time, user data with index=* plus Latest event / sourcetype, the pipe with Monitoring Console Indexing and Forwarders Status, and — if ES is installed — the queue with Incident Review Owner.”
2. Mental model — six proof surfaces
Memorise six named objects before you click. Each surface is allowed to prove one thing. Over-claiming a field is how you bounce a healthy indexer at 02:00.
1 · Search index=_internal
Apps → Search & Reporting. Official Search app: type index=_internal and press Enter. Proves this instance is writing its own logs (splunkd.log, metrics.log). Does not prove a customer sourcetype.
2 · Search index=*
Same Search bar. index=* matches non-internal indexes. Underscore indexes (_internal, _audit, _introspection) stay out unless you name them. Empty * plus a live _internal is a user-data question.
3 · Last event time
Settings → Indexes column Latest event, or | stats latest(_time) by sourcetype / | tstats latest(_time) where index=X by sourcetype. Proves when that index last saw an event. Not a dashboard vibe.
4 · sourcetype
Default index-time field (with host, source, timestamp). Data Summary → Sourcetypes. After index time you cannot rewrite it without re-indexing. Names the missing kind of data.
5 · Monitoring Console
Settings → Monitoring Console. Indexing: Performance / Indexes and Volumes. Forwarders: Deployment → Status = active or missing (15-minute lookback). Official order if data is missing: Forwarders → Splunk TCP Input → Indexing.
6 · Notable / ES (if present)
ES menu → Incident Review. Proof fields: Owner (Unassigned), Status (New / In Progress / Pending / Resolved / Closed), Urgency. Skip this surface if ES is not installed. Do not invent a notable from raw SPL.
Read left → right. Each box is allowed one claim. If you cannot name the field, you are not proving — you are guessing.
I prove the search head, then user indexes, then last event time and sourcetype, then the forwarder, then — if ES is installed — the notable owner. I do not rebuild an index or disable a correlation search until I can quote the field that made me do it.
_time is the event timestamp, shown in the search-head user timezone. _indextime is when the indexer wrote it. Official delay search: eval delay_sec=_indextime-_time. If internal logs are delayed too, the delay page says it is a forwarding issue. Time range picker default is Last 24 hours. Status active / missing on Forwarders: Deployment looks back 15 minutes — not “forever.”
3. Decision flow — ticket → first tool
Flowchart first. Do not open the indexer CLI until a diamond says so.
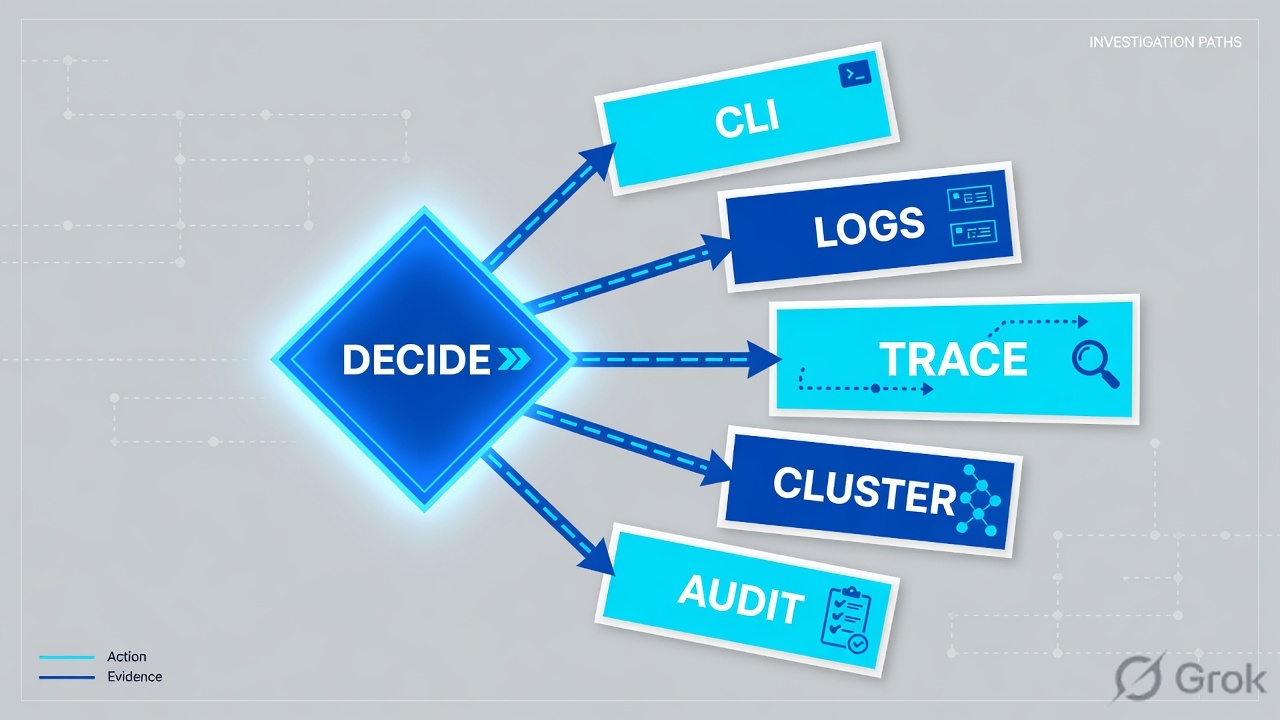
Read the diamond first. A silent host never starts in a new correlation search. A live _internal plus empty index=* never starts as “Splunk is down.” Unassigned urgency never starts as a rebuild.
4. How to choose — first tool + proof field
Print this next to the search head. If you cannot recite the proof field, you are not ready to change anything.
| If the ticket says… | First tool (official path) | Proof field | Do not open first |
|---|---|---|---|
| “Is Splunk even working?” / search page spins | Apps → Search & Reporting · Search bar index=_internal · Time range picker |
Jobs event count + last event _time (Events tab, most recent first) |
Indexer restart, a new correlation search |
| “Why no events?” after a TA / index change | Same Search: index=* then the named index. Then Settings → Indexes |
Latest event on that index, plus sourcetype (Data Summary or fields sidebar) |
Rebuild the index, page “Splunk is down” |
| One host / one sourcetype vanished; peers still index | Settings → Monitoring Console → Forwarders: Deployment | Status = active or missing (scheduled search looks back 15 minutes) | Disable the sourcetype on healthy peers |
| Everything late, including internal logs | Monitoring Console → Indexing: Performance, then the official delay SPL | delay_sec = _indextime - _time on index=_internal source=*splunkd.log* and on the user source |
A new URL-style “allow” in ES |
| High notable in the queue (ES installed) | ES menu → Incident Review | Owner + Status + Urgency (assign before more SPL) |
Disable the correlation search at 02:00 |
Internal indexes start with an underscore. index=* does not pull _internal, _audit, or _introspection. A live _internal plus empty index=* means user indexes in this window are empty or you lack permission — not that Splunk is off. Name the index the TA writes. Source: About indexes and indexers; About the Search app.
5. Runbook Side A → B → C
Side A proves the search head and the user-data question. Side B proves the pipe (Monitoring Console indexing + forwarder Status). Side C proves the ES queue if Enterprise Security is installed. On a messy Sev-2, do them in this order until a field lights up.
Side A — Search, last event, sourcetype
-
Prove the search head with
index=_internalPath: Splunk Home → Search & Reporting (Search Summary, then New Search after you run). Official: About the Search app — type
index=_internaland press Enter to look at events from internal log files. Set the Time range picker (default Last 24 hours). Quote the job event count and the newest_timeon the Events tab. -
If
_internalis live, ask the user-data questionSame Search bar:
index=*in the same window. Then name the index the ticket actually cares about (index=wineventlog,index=netfw— lab names only). Official “I can’t find my data”: your time range could be excluding the events — search over All time to verify before you page platform. -
Read Latest event, then sourcetype
Path: Settings → Indexes (Create custom indexes). Quote Latest event for that index. Or run
| tstats count latest(_time) as last_event where index=<name> by sourcetype(tstats uses index-time fields). Data Summary tabs are Hosts, Sources, Sourcetypes — pick Sourcetypes to name the missing kind. -
Pin timezone with the window
Official: How time zones are processed —
_timeis converted to the user-profile timezone on the search head. An IST “Last 4 hours” at 10:00 will miss a 02:00 UTC incident. Write the timezone next to earliest / latest. This is still Side A. It is not an indexer outage.
Apps / Search & Reporting / Search
New Search
| _time | host | source | sourcetype |
|---|---|---|---|
| 01:39:12 | sh-lab-01 | /opt/splunk/var/log/splunk/metrics.log | splunkd |
| 01:39:08 | sh-lab-01 | /opt/splunk/var/log/splunk/splunkd.log | splunkd |
index=_internal → 18,442 events · last _time 01:39:12Z
index=* → 0 events in Last 15 minutes
Do not say “Splunk is down.” Name the user index next.
Source: Splunk Docs — About the Search app (type index=_internal; Time range picker default Last 24 hours; Events tab, event count). Hostnames above are lab labels. Training mock · not live.
Path:     Apps → Search & Reporting
Prove SH: index=_internal   picker=Last 15 minutes
Quote:    event count + newest _time + user timezone
User data: index=*   then index=<named>
Latest:   Settings → Indexes → Latest event
          or | tstats count latest(_time) as last_event
             where index=<named> by sourcetype
Empty?:   Search All time before you page platform
          (I can’t find my data)
Side B — Monitoring Console indexing + forwarder Status
-
Open Forwarders first when one host is silent
Path: Settings → Monitoring Console → Forwarders: Deployment (configure Forwarder Monitoring Setup first — official prerequisite). Quote Status: active if the forwarder connected to an indexer in the last 15 minutes; missing if it did not. The lookback is not the data-collection interval. Rebuild the forwarder asset table only to drop permanently gone hosts.
-
Then Splunk TCP Input, then Indexing
Official order if you cannot find indexed data: (1) Forwarder views (2) Splunk TCP Input views (3) Indexing views. Monitoring Console does not query forwarders directly — it reads indexer
metrics.log. Path for indexing: Indexing: Performance and Indexing: Indexes and Volumes. -
If everything is late, including internal logs, treat it as forwarding
Official Event indexing delay:
index=_internal source=*splunkd.log* | eval delay_sec=_indextime-_time | timechart min(delay_sec) avg(delay_sec) max(delay_sec) by host. Compare with the user source. If all logs are delayed, including internal, the delay is a forwarding issue. Universal / light forwarders default thruput is 256 KBps.
Settings / Monitoring Console / Forwarders / Deployment
Forwarders: Deployment
| Forwarder | Status | Last connected | Outgoing rate (indexer) |
|---|---|---|---|
| uf-pune-01.lab.example | active | 01:38 UTC | 1.2 MB/s |
| uf-pune-fw.lab.example | missing | 00:11 UTC | — |
| hf-core-01.lab.example | active | 01:39 UTC | 8.4 MB/s |
Source: Splunk Docs — Forwarders (Monitoring Console): Status active / missing, 15-minute lookback; Configure forwarder monitoring; official missing-data order Forwarders → Splunk TCP Input → Indexing. Lab hostnames only.
The silent host’s Status is missing and a peer on the same index is active. Or Indexing: Performance shows the indexer still writing while one GUID is gone. You have isolated the pipe. You have not proved a notable.
Side C — Incident Review (only if ES is present)
-
Open Incident Review, not a new correlation search
Path: Splunk Enterprise Security menu bar → Incident Review. Official ES 7 user guide: the dashboard displays notable events and current status. Filter time, then Owner / Status / Urgency. ES 8 re-architected some pages — if your tenant says Mission Control / Analyst Queue, use that equivalent. If ES is not installed, stop after Side B.
-
Assign Owner before you hunt
Official workflow: administrative analyst assigns the notable; reviewing analyst sets Status from New to In Progress, records Comments, then Resolved / Closed. Proof fields:
Owner(Unassigned is a process miss),Status,Urgency(Critical / High / Medium / Low / Informational / Unknown). -
Do not disable the correlation search at 02:00
A noisy high notable with a healthy last-run is isolate, not change-control. The factory lesson covers CIM when
useris empty. This desk only asks: is the notable owned, and did Side A already prove the contributing index is searchable?
Enterprise Security / Incident Review
Incident Review
| Time | Title | Urgency | Status | Owner |
|---|---|---|---|---|
| 01:12 UTC | MFA spike · finance.user | High | New | Unassigned |
Source: Splunk Docs — Overview of Incident Review; Take action on a notable (Owner, Status New / In Progress / Pending / Resolved / Closed, Urgency). Skip this mock if the lab has no ES. Training mock · not live.
- Side A search head:
index=_internalreturns a count and a last_timeinside the picker. - Side A user data: named index Latest event +
sourcetypequoted, or All time still empty with a reason (wrong index / no permission / true gap). - Side B: Forwarders Status active or missing on the GUID, or delay_sec on internal + user source.
- Side C (if ES): Incident Review Owner is no longer Unassigned; Status moved off New.
6. Five tickets as full stories
These five land every quarter. Memorise first tool + proof field. Times and identities below are lab-only.
| Ticket | Symptom | First tool | Proof field |
|---|---|---|---|
| SPED-01 | “Is Splunk even working?” CIO in Slack | Search index=_internal | Event count + last _time |
| SPED-02 | App team: “no events” after a TA change | index=* then Settings → Indexes | Latest event + sourcetype |
| SPED-03 | Pune firewall sourcetype silent since 02:00; peers ok | DMC Forwarders: Deployment | Status missing / active (15 min) |
| SPED-04 | Everything late, including splunkd | DMC Indexing + delay SPL | delay_sec on internal and user source |
| SPED-05 | High notable, nobody owns it (ES present) | Incident Review | Owner + Status + Urgency |
SPED-01 — Prove the search head (index=_internal)
01:42 · P2. Priya: “Splunk is down.” Someone already drafted an indexer restart window.
First tool: Apps → Search & Reporting. Search bar index=_internal. Picker Last 15 minutes.
If events exist: quote the count and the newest _time. Splunk is searching and writing internal logs. You are now allowed to ask the user-data question. _internal is not a customer sourcetype.
If empty: widen to Last 60 minutes / All time (official “I can’t find my data”). Still empty → Side B Indexing, not a new notable.
Do not trust a colleague’s search from a different app context or a restricted role. The proof is on a role that can read _internal, on this search head, in a stated timezone.
SPED-02 — Prove last event time and sourcetype
02:05 · P2. After last night’s TA ship, the app team searched index=main Last 15 minutes and got 0. They want the index rebuilt.
First tool: same Search app. index=_internal first (SPED-01). Then index=*. Then the index the TA actually writes — not main by habit. Open Settings → Indexes and read Latest event.
Proof field: Latest event on wineventlog (lab) is 01:58 UTC, sourcetype WinEventLog:Security. index=main Latest event is yesterday. The events are not missing. The search is on the wrong index. Re-run the TA’s documented index + sourcetype in the ticket window.
I would not rebuild. I would paste Latest event + sourcetype + the SPL that returned a count. Empty main is allowed when the TA never wrote there.
SPED-03 — Prove forwarder Status
02:20 · P1. Pune branch firewall logs vanished at 02:00 after a jump-host change. Other sites still index cisco:asa.
First tool: Monitoring Console → Forwarders: Deployment. Filter the Pune GUID / hostname.
Proof field: Status = missing (no connection in the 15-minute lookback). Peer uf-pune-01 is active. Next official views: Splunk TCP Input, then Indexing. Do not disable the sourcetype on healthy peers. Do not declare a tenant indexing outage from one missing GUID.
Quote Status missing + last connected + a peer that is active on the same index. Restore the forwarder / 9997 path, wait for Status active and a new Latest event on that sourcetype.
SPED-04 — Prove indexing delay (internal logs late too)
02:40 · P2. SOC: “events are 40 minutes late.” Someone wants the indexers restarted.
First tool: Monitoring Console → Indexing: Performance, then the official delay searches.
Proof field: delay_sec on index=_internal source=*splunkd.log* and on the user source, by host. Official rule: if all logs are delayed, including internal, it is a forwarding issue (thruput, blocked output, receiver). If only the user source is late, stay on that input / timezone / _time extraction — not a cluster bounce.
A peak on the Search timeline is not delay. Delay is _indextime - _time. Restarting a writing indexer is change-control.
SPED-05 — Prove the notable (ES if present)
03:00 · P2. High notable “MFA spike” sits Unassigned. L1 wants the correlation search disabled.
First tool: ES → Incident Review. If ES is not installed, this ticket is not an ES ticket — go back to Side A count.
Proof field: Owner = Unassigned, Status = New, Urgency = High. Official first action is assign, then In Progress, then investigate. Side A must already show the contributing index is searchable. Disabling the search is a change window, not isolate.
I would assign an owner and paste Owner + Status + Urgency. I would not disable the correlation search from an Unassigned row.
7. Traps + close-the-ticket proof
| You see | Weak close | Strong close |
|---|---|---|
index=_internal has events | “Splunk is fine” | You only proved the search head. Open the named user index. |
index=_internal empty in 15 min | Restart all indexers | Widen the picker / All time; then DMC Indexing. Quote last _time. |
index=* empty, _internal live | “Splunk is down” | User indexes in this window are empty or restricted. Name the TA index. |
index=main = 0 | Rebuild main | Settings → Indexes Latest event on the index the TA writes + sourcetype. |
| IST Last 4 hours, incident at 02:00Z | Page indexer on-call | Timezone / picker never covered the event. Official time-zone processing. |
| One sourcetype silent | Disable the sourcetype everywhere | Forwarders Status missing vs a peer that is active. |
| Status missing for 20 minutes | Rebuild the asset table as the fix | Missing is the 15-minute lookback. Restore the GUID; asset rebuild only drops ghosts. |
| User events late; internal not late | Forwarder outage | Input / timestamp extraction / that sourcetype. Compare delay_sec. |
| Internal + user both late | New ES correlation search | Official: forwarding issue. Check thruput / receiver. |
| High notable Unassigned | Disable the correlation search | Incident Review Owner + Status. Assign first. |
| No ES installed | Invent a notable from raw SPL | Stop after Side B. Quote count + Latest event only. |
- Timezone written next to earliest / latest.
- Search head proved with
index=_internalevent count + last_timewhen the ticket is “is Splunk working?” - One user-data quote: named index Latest event +
sourcetype, or Forwarders Status, ordelay_sec, or Incident Review Owner. - Next tool named — or change-control owner named. No indexer bounce without residual control.
- Peer host or second index compared when you claim “not a cluster outage.”
- ES skipped cleanly when the app is not installed.
I name the question, then the first tool, then one official field. index=_internal proves the search head. index=* plus Latest event and sourcetype prove user data. Monitoring Console Status proves the forwarder. delay_sec proves late versus missing. Incident Review Owner proves the ES queue. I do not rebuild an index or disable a correlation search until that field is on the ticket. Factory sentence: always state index + time + count.
Knowledge check
Six night-shift judgments. Each maps to a first tool or a proof field. Check answers, then Reset if you picked the wrong surface.
Sources
- Splunk Docs — About the Search app (
index=_internalin the Search bar; Time range picker; event count; Hosts / Sources / Sourcetypes) - Splunk Help — About the Search app (9.3)
- Splunk Docs — Start searching
- Splunk Docs — Specify time ranges (earliest / latest)
- Splunk Help — How time zones are processed by the Splunk platform
- Splunk Help — I can’t find my data! (time range may exclude events; search All time)
- Splunk Docs — About indexes and indexers
- Splunk Docs — Create custom indexes (Settings → Indexes)
- Splunk Docs — About default fields (
host,source,sourcetype, timestamp) - Splunk Docs — Why source types matter
- Splunk Docs — Index time versus search time
- Splunk Docs — tstats (index-time fields;
latest(_time)) - Splunk Docs — About the Monitoring Console
- Splunk Docs — Indexing: Performance
- Splunk Docs — Indexing: Indexes and Volumes
- Splunk Docs — Forwarders (Monitoring Console) (Status active / missing; 15-minute lookback; Forwarders → TCP Input → Indexing)
- Splunk Docs — Configure forwarder monitoring
- Splunk Docs — Event indexing delay (
_indextime-_time; internal logs delayed ⇒ forwarding) - Splunk Docs — What Splunk software logs about itself
- Splunk Help — About metrics.log
- Splunk Docs — Troubleshoot forwarder/receiver connection
- Splunk Docs — Overview of Incident Review (Owner, Status, Urgency)
- Splunk Help — Take action on a notable on Incident Review
- Splunk Splexicon — Notable event
- Splunk Splexicon — Monitoring Console
Related: Blog 1 · Splunk search factory · ES notables & CIM · SPL search · Forwarders & clustering · Splunk practice hub