Assets / Asset Details answers “is this host even in Rapid7?” Data Collection Health → Collectors answers “is the collector Active, and is this event source Running with incoming data?” Investigations + Detection Rule Library answers “did a rule fire — and is Rule Action Creates Investigations, Tracks Notable Events, or Off?” Last Scan / Last Scan Time answers “when was this asset last assessed by a scan engine or by the Insight Agent?” Vulnerabilities answers “is this finding real — First Found, risk, exception?” A green dashboard tile is not an asset record. An empty investigation queue is not a dead platform.
1. Why “is Rapid7 seeing it?” is five questions
Operators collapse five failures into one sentence. The laptop was never an assessed asset. The Pune collector went Inactive. The detection rule’s Rule Action is Off (or an exception swallowed the user). The site Last Scan is a discovery ping from last month. The CVE is First Found on a different host, or already excepted. Those are five first clicks.
This page is the night-shift desk for proof. The factory taught the product pick — InsightVM is weakness, InsightIDR is behavior, same host is a pivot. Here you learn the five tools you actually open, in order, when someone asks you to prove Rapid7 is seeing this asset — or to explain why there is no detection.
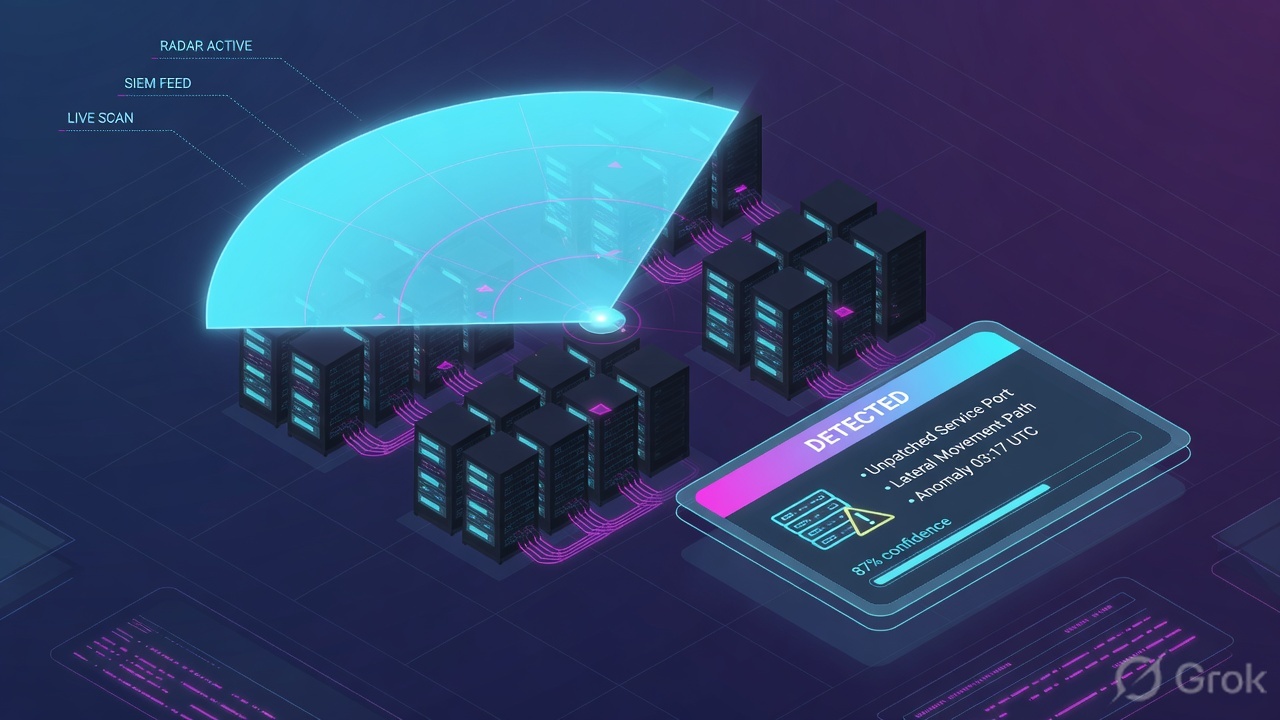
If they say “prove Rapid7 is seeing this asset,” do not say “I opened InsightIDR.” Say: “I prove the host on Assets / Asset Details, the pipe with Data Collection Health Collectors Active/Inactive plus event-source Running and incoming data, the detection with Investigations Status + Detection Rule + Rule Action, the assessment with Last Scan versus Last Scan Time, and the finding with First Found + risk + exception.”
2. Mental model — five proof tools
Memorise five named objects before you click. Each tool is allowed to prove one thing. Over-claiming a field is how you quarantine a box that was never in inventory, or flip a Rule Action because Log Search was empty for the wrong hour.
1 · Asset
InsightVM Assets (Assessed / Unassessed). InsightIDR Asset Details (global search). Proves hostname, IP, site, OS, agent present. Does not prove a collector is up or a CVE is First Found.
2 · Collector health
Data Collection → Data Collection Health → Collectors. Proves the on-prem pipe: Active / Inactive, hostname, IP, CPU / memory. Event Sources tab: Running + Monitor Health incoming vs parsed. Does not prove a Rule Action.
3 · Investigation / detection
Investigations + Detection Rules → Detection Rule Library. Proves Status, Priority, Detection Rule, Rule Action (Creates Investigations / Creates Alert / Tracks Notable Events / Assess Activity / Off), Exceptions. Empty queue is data.
4 · Last scan
Site / Assets Last Scan = last discovery, vulnerability, or policy scan. Query Builder Last Scan Time = last Insight Agent assessment. Asset Details Last On Demand Agent Scan. Completed ≠ authenticated.
5 · Vulnerability
Security Console Vulnerabilities / asset listing. Proves First Found, risk score, CVSS, Severity, Instances, exception (reason + expiry). A weekly PDF tile is not a finding.
Hard words, once
Collector ≠ Insight Agent ≠ Scan Engine. Assessed = scanned or agent-installed. Last Scan ≠ Last Scan Time. Rule Action Off = no investigation by design. First Found = first detect in the environment.
Read left → right. Each box is allowed one claim. If you cannot name the field, you are not proving — you are guessing.
I prove the asset, then the collector, then the investigation / Rule Action, then the last scan, then the vulnerability. I do not Quarantine Asset, Scan Now a VLAN, or flip a detection rule until I can quote the field that made me do it.
3. Decision flow — ticket → first tool
Flowchart first. Do not open Take Action → Quarantine Asset, and do not click Scan Now, until a diamond says so.
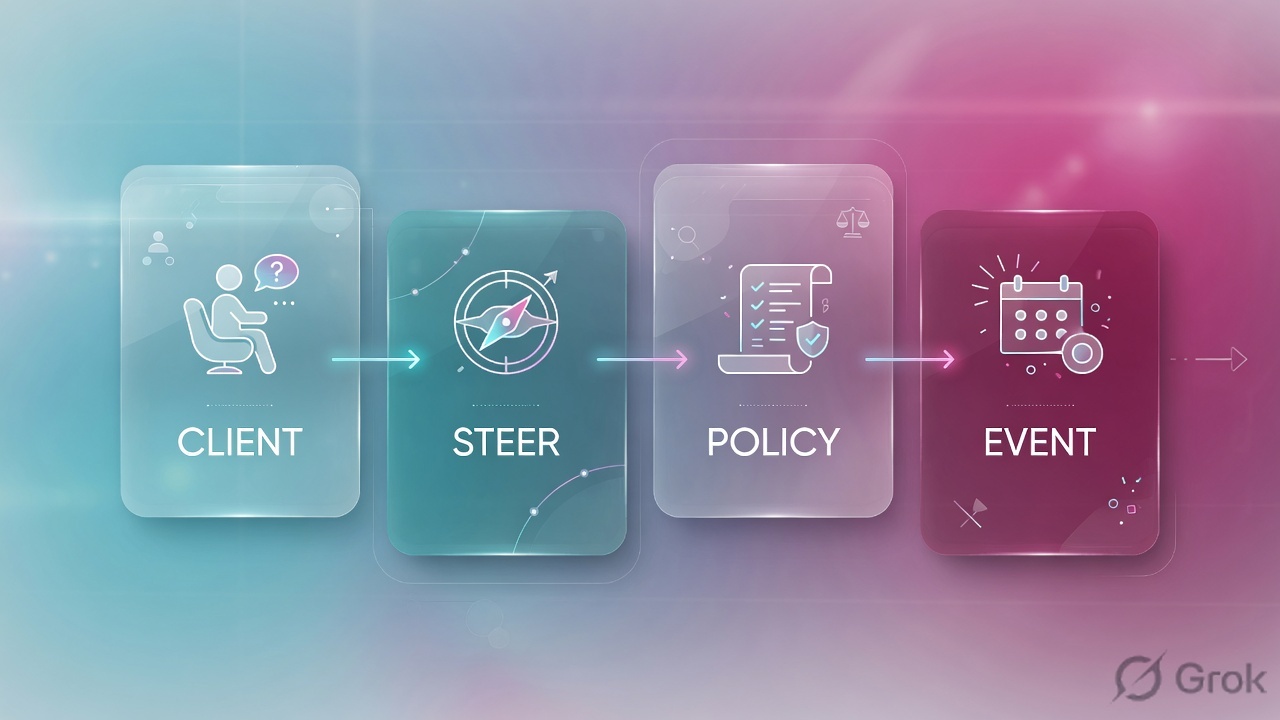
Read the diamond first. A missing host never starts in Detection Rules. “Why no detection?” never starts in Vulnerabilities. A stale Last Scan never starts in Quarantine Asset.
4. How to choose — first tool + proof field
Print this next to the InsightIDR and Security Console tabs. If you cannot recite the proof field, you are not ready to change anything.
| If the ticket says… | First tool (official path) | Proof field | Do not open first |
|---|---|---|---|
| Laptop / new VM / “is Rapid7 even seeing this host?” | InsightVM Assets (Assessed / Unassessed / Discovered). InsightIDR global search → Asset Details | Hostname + IP + site + Assessed vs Unassessed (or agent present on Asset Details) | Quarantine Asset / Detection Rule Library |
| Whole site silent / “collector not seeing this asset” / Log Search empty | SIEM (InsightIDR) Data Collection → Data Collection Health → Collectors, then Event Sources Monitor Health | Collector Active / Inactive + event source Running + incoming vs parsed (and any orange/red error) | A new URL-style Allow, or flipping Rule Action Off |
| “Why no detection?” / PowerShell seen on the box, queue is empty | Investigations (filter Detection Rule + asset) then Detection Rules → Detection Rule Library | Investigation Status + Detection Rule + Rule Action + Exceptions tab |
Scan Now of the VLAN / VM exception |
| “When did we last assess this?” / weekly PDF looks thin | Site detail / Assets Last Scan. Query Builder Last Scan Time. Asset Details Last On Demand Agent Scan | Last Scan (engine: discovery / vuln / policy) vs Last Scan Time (Insight Agent) | Take Action → Quarantine |
| “Critical CVE — isolate it” / finding looks new on a freeze host | Security Console Vulnerabilities → asset listing | First Found + risk score + Severity + whether an exception already exists (reason + expiry) | InsightIDR Rule Action change |
Rapid7 documents two different clocks. Last Scan on the Sites detail page or Assets is the last time a discovery, vulnerability, or policy scan was run. Last Scan Time in Query Builder is the last time the asset was assessed by the Rapid7 Agent (Insight Agent). Quoting the wrong column is how you tell a change board “we scanned yesterday” when only an agent heartbeat moved.
5. Runbook Side A → B → C
Side A proves the host exists and the collector pipe is alive. Side B proves why a detection did or did not become an investigation. Side C proves the last assessment and the vulnerability finding. On a messy Sev-2, do them in this order until a field lights up.
Side A — Asset, then collector (is the collector seeing this asset?)
-
Search the asset before you argue about detections
InsightVM: click the Assets icon. Official: Locating and working with assets. Sort / search by address, name, site, OS, last assessed. Assessed = scanned or Insight Agent installed. Unassessed / Discovered = seen by a dynamic discovery connection (LDAP, Azure, AWS) and assigned to a site, but not yet assessed for vulnerabilities or policy. InsightIDR: global search for hostname or IP → Asset Details (Assets on Your Domain). Quote hostname, IP, site. If there is no record, stop. There is no investigation and no First Found to chase.
-
Open Data Collection Health, not Detection Rules
Path: left menu Data Collection, or top-right Data Collection icon → Data Collection Health. Then Collectors. Official: Collector Troubleshooting — view Linux Collector details on Data Collection > Data Collection Health > Collectors. Quote hostname, IP, OS, CPU / memory when shown. Official state you care about: Collector Shows as Inactive. Restart is
service collector restart(Linux, may need sudo) or the Windows Services app → Collector. Do not flip a Rule Action because the collector is dark. -
Prove the event source, not the dashboard tile
Same Data Collection page → Event Sources tab. Status lives under the event source name: Running, or actions Start Running / Stop Running. Click Monitor Health. Official: incoming data (events received per minute, compressed data sent to the platform) and parsed vs unparsed. Orange warnings / red errors under the name are the ticket. Source: Monitor Event Source Health; Event Source Troubleshooting.
-
If the card says Running and Log Search is empty, stay on the pipe
Official unexpected case: event source appears correctly running, but no data. Causes Rapid7 names: the collector that hosts the event source is inactive; something is blocking the connection (firewall, endpoint protection, proxy); or the source is ingesting data that is not being parsed (EPM can move while Log Search has no log). Generate a test event (user, machine, exact timestamp). Non-English fields go to Unparsed Data. A test environment may be dropped on purpose. Source: Event Source Troubleshooting.
Data Collection / Data Collection Health / Collectors
Collectors
| Object | Name | Status | Proof |
|---|---|---|---|
| Collector | r7-col-pune-01 | Inactive | No hostname / CPU while down |
| Event source | DC-LAB-01 AD Security | Running | Monitor Health: incoming 0 / min |
Collector Shows as Inactive — restart Collector service, then re-read Incoming Data.
Event source Running + incoming 0 is still a pipe ticket, not a Rule Action ticket.
Source: Rapid7 Docs — Collector Troubleshooting (Data Collection > Data Collection Health > Collectors; Collector Shows as Inactive); Monitor Event Source Health; Event Source Troubleshooting (Running vs incoming). Lab identities only. Training mock · not live.
Side B — Investigation / detection (why no detection?)
-
Open Investigations, not Vulnerabilities
Left menu Investigations. Official filters: Date Range (default 28 days), Priority (Critical / High / Medium / Low), Status (Open, Investigating, Waiting, Closed), Detection Rule, Investigation Type (User, Detection Rule, Scheduled Endpoint Queries, Automation), Assignee. Search by investigation name, user, or asset. Expand the card for linked assets / users. If the queue is empty for that asset + rule + window, that emptiness is evidence — do not invent a quarantine.
-
Read Status, Detection Rule, Priority, Disposition
Open the investigation. System-created names come from the detection rule that triggered them. Quote Status, inherited Priority, Assignee, Disposition. Official dispositions: Undecided, Benign, Malicious, Unknown, Not Applicable, Security Test, False Positive. You cannot close while disposition is Undecided. Timeline icons include Alert, Notable behavior, Logs, Workflow, Endpoint queries, Notes, User, Asset, Automation workflow. Source: Investigations; Analyze an investigation.
-
If there is no investigation, open the Detection Rule Library
Path: Detection Rules → Detection Rule Library. Open the rule that should have fired. Official Rule Actions: Creates Investigations, Creates Alert, Tracks Notable Events, Assess Activity (7-day score, then auto Off unless you change it), Off. Off and Assess Activity are allowed to produce an empty Investigations queue. Then open the Exceptions tab — an exception-level Rule Action overrides the rule for that user / asset / IP. Quote Exception Name + exception matches. Source: Modify Detection Rules.
-
Only then use Log Search as residual proof
From Asset Details, Search Related Logs opens Log Search with the asset in the query bar (default last hour — widen the UTC window on the ticket). From an investigation: Explore Contextual Data → Search Logs, then Add to Investigation. Audit Logs log set holds investigation and alert updates. Empty parsed logs after a healthy collector is a parsing ticket, not a “Rapid7 is down” ticket.
Investigations / INV-1042 · then Detection Rules / Detection Rule Library
Investigation details
Investigations filter asset=10.10.8.22 + last 24h → 0 rows
Library: Rule Action = Off · Exceptions tab: asset is 10.10.8.22 · matches=14
Source: Rapid7 Docs — Investigations (filters, Status, Detection Rule); Analyze an investigation (Priority, Disposition); Modify Detection Rules (Rule Action, Exceptions). Lab identities only.
Path A:  Investigations  · filter asset + Detection Rule + UTC window
Quote:   Status + Priority + Detection Rule + Disposition
If empty:
Path B:  Detection Rules → Detection Rule Library → rule details
Quote:   Rule Action (Creates Investigations / Creates Alert /
         Tracks Notable Events / Assess Activity / Off)
Then:    Exceptions tab · Exception Name · exception matches
Residual: Asset Details → Search Related Logs (widen past 1 hour)
Side C — Last scan + vulnerability (VM proof)
-
Quote the correct clock
Sites page / site detail: Last Scan (or Last Scanned) is the last discovery, vulnerability, or policy scan — click the date to open that scan. View Scan History on the site. Deployment-wide: Administration → Scans > History → View current and past scans. Query Builder: Last Scan Time = last Insight Agent assessment. Asset Details: Last On Demand Agent Scan (Complete + date/time). Do not tell change-control “we scanned yesterday” from the agent clock when they asked for a vulnerability scan.
-
Completed is not authenticated
After the scan, Administration → Scans → History → the Scan Name → Completed Assets → Authentication column. Official success line in the scan log: “A set of [service_type] administrative credentials have been verified.” Test Credentials on the shared or site-specific credential before you call the box clean. Zero local vulns after an unauthenticated ping is not a clean box. Source: Configuring site-specific scan credentials; Using the Insight Agent with InsightVM.
-
Open the finding, not the weekly PDF
Security Console Vulnerabilities icon → Vulnerability Listing. Click the vulnerability, then the asset. Quote First Found (date the vulnerability was first detected in the environment), risk score, CVSS (default CVSS:3.1 when present), Severity (Moderate 0–3.4 / Severe 3.5–7.4 / Critical 7.5–10 on Rapid7’s CVSSv2-derived severity), Instances, exploit / malware kit icons. Then check whether a vulnerability exception already exists (reason, scope, expiry). Source: Working with vulnerabilities; Working with vulnerability exceptions.
- Side A asset: hostname + IP on Assets / Asset Details, Assessed (or agent present). Side A pipe: collector Active, event source Running, Monitor Health shows incoming in the ticket window.
- Side B: investigation Status + Detection Rule + Rule Action quoted — or empty queue explained by Off / Assess Activity / exception matches.
- Side C clock: Last Scan (engine) or Last Scan Time (agent) named correctly. Side C finding: First Found + risk + exception (or none) on that asset.
6. Five tickets as full stories
These five land every quarter. Memorise first tool + proof field. Times and identities below are lab-only.
| Ticket | Symptom | First tool | Proof field |
|---|---|---|---|
| R7EVD-01 | WFH laptop: “is Rapid7 even seeing this host?” | Assets / Asset Details | Hostname + IP + Assessed vs Unassessed |
| R7EVD-02 | Pune DC silent since 02:00; Log Search empty | Data Collection Health → Collectors | Collector Active/Inactive + event source Running + incoming |
| R7EVD-03 | PowerShell on 10.10.8.22; “why no detection?” | Investigations + Detection Rule Library | Status + Detection Rule + Rule Action + Exceptions |
| R7EVD-04 | Weekly PDF thin; “when did we last scan SITE-LAB-01?” | Site Last Scan / Query Builder Last Scan Time | Last Scan (engine) vs Last Scan Time (agent) |
| R7EVD-05 | “Critical CVE — isolate it” on a freeze host | Vulnerabilities → asset listing | First Found + risk + exception reason/expiry |
R7EVD-01 — Prove the asset (Assets / Asset Details)
01:42 · P2. Priya on a hotel network. Screenshot of an InsightIDR dashboard tile. L1 already drafted Quarantine Asset “just in case.”
First tool: InsightVM Assets search win-l2-08.lab.example / 10.10.8.22. If VM is empty, InsightIDR global search → Asset Details.
If missing: no Assessed row, no Unassessed / Discovered row, no Asset Details. Quote that absence. Next check is site include (IP range / asset group) or Insight Agent install — not Detection Rules, not Take Action.
If present: quote hostname, IP, site SITE-LAB-01, Assessed vs Unassessed, agent present or not. You are now allowed to open collector health (IDR ticket) or Last Scan (VM ticket). Asset Details is not First Found and is not Rule Action.
Do not quarantine a hostname from Slack. The proof is the Assets / Asset Details record. Unassessed is not “Rapid7 is down” — it is discovered, not yet assessed.
R7EVD-02 — Prove the collector (Data Collection Health)
02:05 · P1. Pune AD authentications vanished after a 02:00 firewall change. Event source card still says Running. Someone wants every detection rule set to Creates Investigations.
First tool: Data Collection → Data Collection Health → Collectors. Filter r7-col-pune-01.
Proof field: Collector Inactive (official: Collector Shows as Inactive), or Active but Event Sources → Monitor Health incoming = 0 in the ticket window, with an orange/red error. Running + incoming 0 is still a pipe ticket. Restore 443 to the regional data.insight.rapid7.com endpoint (and the documented ingress / S3 destinations), restart the Collector service, then wait for incoming and the first Log Search row. Do not flip Rule Action on an Inactive collector.
I would not rewrite detections. I would quote Collector Inactive (or Running + incoming 0 + the error). Service restart, then Monitor Health incoming in the same UTC window. Email can also fire when a collector is offline 15 minutes — that mail is a pointer, not the close.
R7EVD-03 — Prove the detection (Investigations + Rule Action)
02:20 · P2. Endpoint owner: “we saw encoded PowerShell on 10.10.8.22 — why no Rapid7 detection?” Collector is Active. Asset exists. L1 wants Quarantine Asset.
First tool: Investigations filtered to that asset + last 24 hours + the expected Detection Rule. Then Detection Rules → Detection Rule Library → that rule.
Proof field: either an investigation with Status + Detection Rule + Disposition, or an empty queue explained by Rule Action = Off (or Assess Activity / Tracks Notable Events) or an Exceptions match on that asset/user. Throttling is official too: 20 alerts per asset per minute, 500 per org per minute — a flood can be missing investigations without the platform being down.
Empty Investigations is allowed when Rule Action is Off or an exception overrode it. Quote the Rule Action and the exception name. Quarantine is InsightIDR Take Action after you have behavior evidence — it is not how you debug a silent rule.
R7EVD-04 — Prove the last scan (Last Scan vs Last Scan Time)
02:40 · P3. Weekly PDF for SITE-LAB-01 looks thin. L1 says “agent is current” and wants Scan Now of the whole VLAN.
First tool: site detail Last Scan / Last Scanned (click the date). Then Query Builder Last Scan Time for 10.10.8.22. Then Asset Details Last On Demand Agent Scan if someone already kicked an agent scan.
Proof field: Last Scan = 2026-07-12 03:10 UTC (discovery or vuln — say which). Last Scan Time = 2026-08-16 01:05 UTC (Insight Agent). Those are different clocks. If Last Scan is a discovery-only run, you have not assessed vulnerabilities. If Authentication on Completed Assets is blank, you have not authenticated. Test Credentials before you call it clean.
Scan Now of the VLAN is change-control, not proof. Last Scan Time moving is not a vulnerability scan. Risk scores are only computed from assets with completed scan status — in-progress assets reuse the last completed result.
R7EVD-05 — Prove the vulnerability (First Found + exception)
03:00 · P2. Slack: “Critical CVE — isolate it.” Same host 10.10.8.22 is in a change freeze. Someone pasted a CVSS 9.8 from a blog.
First tool: Security Console Vulnerabilities → the finding → the asset. Factory reminder: isolation is an InsightIDR / InsightConnect action. A critical CVE is an InsightVM finding.
Proof field: First Found on this asset, risk score, Severity, Instances, exploit / malware-kit icon if present, and whether a vulnerability exception already exists (reason, scope, expiry). If First Found is fourteen months old and an exception expires next week, you do not quarantine at 03:00 — you name the freeze owner. If First Found is tonight and exploitable with a Metasploit module, you still open IDR Asset Details / Investigations before Take Action, because contain needs a single owner.
I would not isolate from CVSS. I would paste First Found + risk + exception expiry (or “no exception”). Then I would name the contain owner only if InsightIDR also has behavior — see the session factory.
7. Traps + close-the-ticket proof
| You see | Weak close | Strong close |
|---|---|---|
| No Assets / Asset Details row | “Rapid7 is down” / Quarantine Asset | Quote the missing record; fix site include or agent install; re-search Assets |
| Unassessed / Discovered only | “Host is clean” | Discovered ≠ assessed. Assign and scan (or install the Insight Agent) |
| Collector Inactive | Set every Rule Action to Creates Investigations | Quote Inactive; restart Collector; re-read Monitor Health incoming |
| Event source Running, Log Search empty | “Detections are broken” | Collector Inactive, blocked port, or unparsed / non-English / test env |
| Empty Investigations | Quarantine the host | Rule Action Off / Assess Activity / exception matches / throttle |
| Rule Action = Tracks Notable Events | “InsightIDR missed it” | Notable events attach to related investigations — they do not open a new one |
| Last Scan Time is fresh | “We scanned yesterday” | That is the Insight Agent clock. Quote Last Scan (engine) if they asked for a vuln scan |
| Scan completed, zero local vulns | “Box is clean — isolate anyway” | Authentication column + Test Credentials. Completed ≠ authenticated |
| CVSS 9.8 in Slack | Take Action → Quarantine Asset | First Found + risk + exception on this asset; product pick from the factory |
| Dashboard tile green | “Rapid7 is working” | Green is not hostname + IP + Active + Rule Action + Last Scan + First Found |
- UTC window written next to the tool you opened.
- Host proved on Assets / Asset Details (or the missing-record sentence) when the ticket is “is Rapid7 seeing this?”
- One pipe quoted: collector Active/Inactive + event source Running + incoming vs parsed — when the ticket is “collector not seeing this asset.”
- One detection quoted: investigation Status + Detection Rule + Rule Action, or empty queue explained by Off / exception / throttle.
- One clock quoted by name: Last Scan (engine) or Last Scan Time (agent), not “we scanned.”
- One finding quoted: First Found + risk + exception — or “no finding on this asset.”
- Next tool named — or change-control / contain owner named. No Quarantine Asset and no VLAN Scan Now without residual control.
I name the question, then the first tool, then one official field. Assets / Asset Details proves the host. Data Collection Health proves the collector. Investigations + Rule Action prove why a detection did or did not land. Last Scan versus Last Scan Time proves the assessment clock. First Found + exception proves the CVE. I do not quarantine, Scan Now, or flip a rule until that field is on the ticket. Product pick and double-isolate: session factory.
Knowledge check
Six night-shift judgments. Each maps to a first tool or a proof field. Check answers, then Reset if you picked the wrong surface.
Sources
- Rapid7 Docs — Locating and working with assets (Assets page; Assessed vs Unassessed / Discovered; Last Scan vs Last Scan Time)
- Rapid7 Docs — Site Detail View (Last Scanned, View Scan History, Scan Now, asset last scan date)
- Rapid7 Docs — Query Builder (Last Scan Time = Insight Agent assessment)
- Rapid7 Docs — Using the Rapid7 Agent (Insight Agent) with Vulnerability Management (Last On Demand Agent Scan · Complete)
- Rapid7 Docs — Viewing scan results and using scan logs
- Rapid7 Docs — Running a manual scan (Administration → Scans > History)
- Rapid7 Docs — Configuring site-specific scan credentials (Completed Assets → Authentication; verified-credentials log line)
- Rapid7 Docs — Configuring scan credentials (Test Credentials)
- Rapid7 Docs — Working with vulnerabilities (Vulnerabilities icon; First Found; risk; CVSS; Severity; Instances)
- Rapid7 Docs — Accepting risk with vulnerability exceptions (reason, scope, expiry)
- Rapid7 Docs — Risk strategies (risk only from completed scan status)
- Rapid7 Docs — Performing filtered asset searches (last scan vs vulnerabilities assessed)
- Rapid7 Docs — Assets on Your Domain (Asset Details; Search Related Logs)
- Rapid7 Docs — Collector Overview (Collector vs Event Source; normalization; attribution)
- Rapid7 Docs — Collector Troubleshooting (Data Collection > Data Collection Health > Collectors; Collector Shows as Inactive)
- Rapid7 Docs — Monitor Event Source Health (Data Collection Health; Monitor Health; incoming vs parsed)
- Rapid7 Docs — Event Source Troubleshooting (Running / Start Running; incoming 0; Inactive collector; unparsed)
- Rapid7 Docs — SIEM (InsightIDR) Event Sources (Data Collection > Event Sources > Add Event Source)
- Rapid7 Docs — Email Notifications (collector offline 15 minutes)
- Rapid7 Docs — Investigations (filters; Status; Detection Rule; system-created; throttle)
- Rapid7 Docs — Analyze an investigation (Status, Priority, Disposition, Take action)
- Rapid7 Docs — Detection Rules (Detection Rule Library)
- Rapid7 Docs — Modify Detection Rules (Rule Action; Exceptions; Assess Activity)
- Rapid7 Docs — Log Search
- Rapid7 Docs — Quarantine an Asset (Take Action; expected offline on Asset Details)
- Rapid7 Docs — Rapid7 Agents (Insight Agents) with SIEM (InsightIDR)
Related: Blog 1 · Rapid7 session factory · InsightIDR UEBA investigation · InsightVM + Exposure Command · Rapid7 Security Platform hub