Network-wide Event log answers “did this network even emit the event we care about, at this time?” VPN Status answers “is this AutoVPN peer reachable, and is the subnet exported?” Appliance status / Traffic analytics answers “is the WAN Active or merely Ready, and did the application even appear?” Wireless Event log + client answers “did this MAC associate, pass 802.1X, and get DHCP?” Switch port / RSTP / LLDP answers “is the port Forwarding, and who is the neighbor?” An MX that is online is not a healthy spoke. A green SSID is not an 802.1X success.
1. Why “is it working?” is five questions
Operators collapse five failures into one sentence. The laptop never associated. The spoke never registered. WAN2 is Ready while WAN1 is Failed. Policy never allowed the VLAN. STP is discarding the AP uplink. Those are five first clicks.
This page is the night-shift desk for proof. The factory taught org → network → SSID vs MX L3 vs AutoVPN. Here you learn the five Dashboard tools you actually open, in order, when someone asks you to prove Meraki is working. Official paths only — documentation.meraki.com.
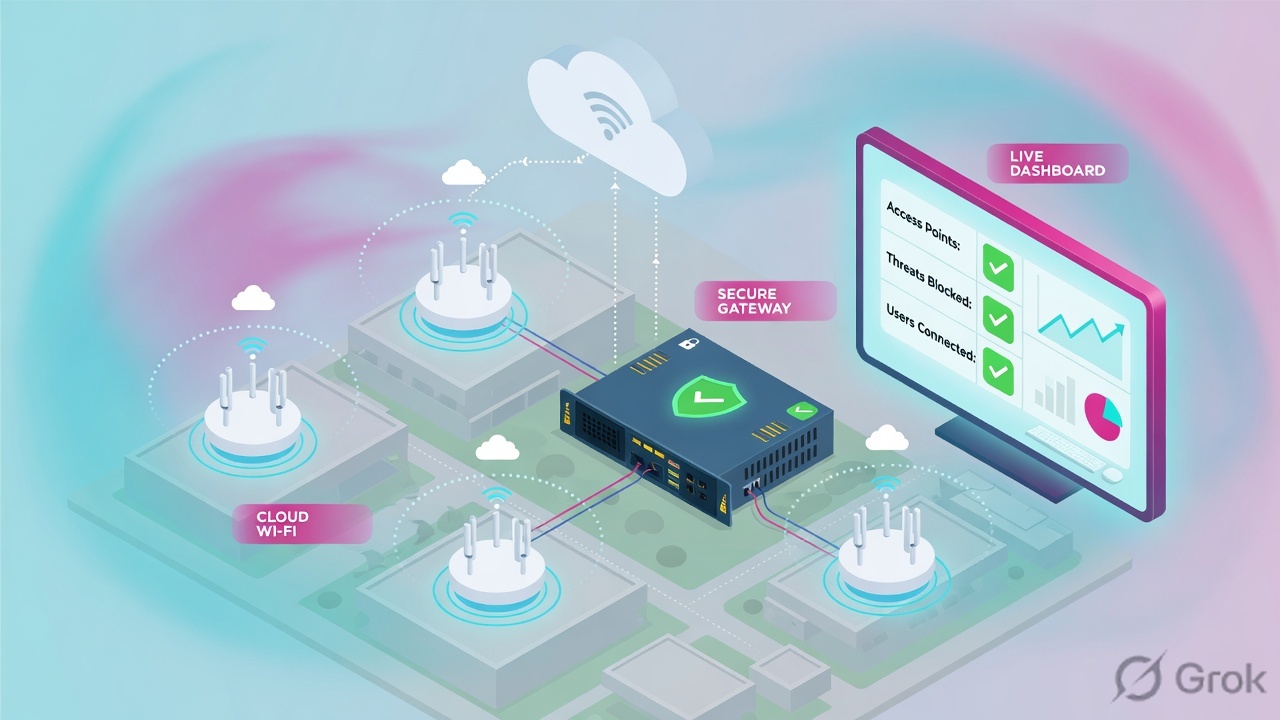
If they say “prove Meraki is working,” do not say “I opened Dashboard.” Say: “I name the org and the network, then I prove the event in Network-wide → Monitor → Event log, the spoke in Security & SD-WAN → Monitor → VPN Status, the WAN in Appliance status → Uplink (Active vs Ready), the client in the wireless Event log (802.11 association + 802.1X EAP), and the cable in Switching → Switches → Ports (RSTP state + LLDP).”
If the top-left picker is still HQ-Lab, the Event log you are reading is the wrong store. Empty rows are data — they usually mean you are on the wrong network, not that “Meraki is down.” Switch the network first. That is the pair lesson: wrong network dashboard is the classic miss.
2. Mental model — five proof tools
Memorise five named objects before you click. Each tool is allowed to prove one thing. Over-claiming a field is how you rebuild a healthy hub at 02:00.
1 · Network-wide Event log
Network-wide → Monitor → Event log. Combined networks: drop-down next to Event log = for access points / security appliances / switches. Filter Client = MAC, hostname, or custom name. Proves one event at one time. Does not prove a hop or an exported subnet.
2 · MX VPN Status
Security & SD-WAN → Monitor → VPN Status (org-wide: Organization → Monitor → VPN Status). Proves AutoVPN / IPsec peer health: Status (green / yellow / red), VPN Registry, NAT Type, exported subnet Yes/No. Latency graphs are AutoVPN only.
3 · Traffic / Appliance status
Network-wide → Monitor → Traffic analytics (needs Traffic analysis = Detailed). Security & SD-WAN → Monitor → Appliance status → Uplink. Proves WAN Active / Ready / Failed and whether an application or hostname even appeared.
4 · Wireless event / client
Same Event log, for access points, Client = that MAC. Or Network-wide → Monitor → Clients → the client. Proves 802.11 association (channel, rssi), 802.1X EAP success / failure, Access point, Signal, Channel. Association is not MX policy.
5 · Switch port / STP / CDP
Switching → Switches → that switch → Ports, or Switching → Switch ports. Proves RSTP state (Forwarding / Blocking), blocking symbol = STP discarding or LACP disabled, and the LLDP neighbor. CDP is official for PoE / Voice VLAN, not a separate Dashboard page.
Hard words, once
Combined network = MX + MS + MR in one picker. VPN Registry = AutoVPN cloud registrar. Ready = healthy, not carrying. vap = SSID index (vap 0 = first SSID). RSTP discarding = loop prevention, not “port is dead.”
Read left → right. Each box is allowed one claim. If you cannot name the field, you are not proving — you are guessing.
I prove the network picker, then the event, then the WAN or the spoke, then the wireless handshake, then the switch neighbor. I do not change Corp, a Layer 3 rule, or AutoVPN until I can quote the field that made me do it.
3. Decision flow — ticket → first tool
Flowchart first. Do not open Firewall or Access control until a diamond says so.
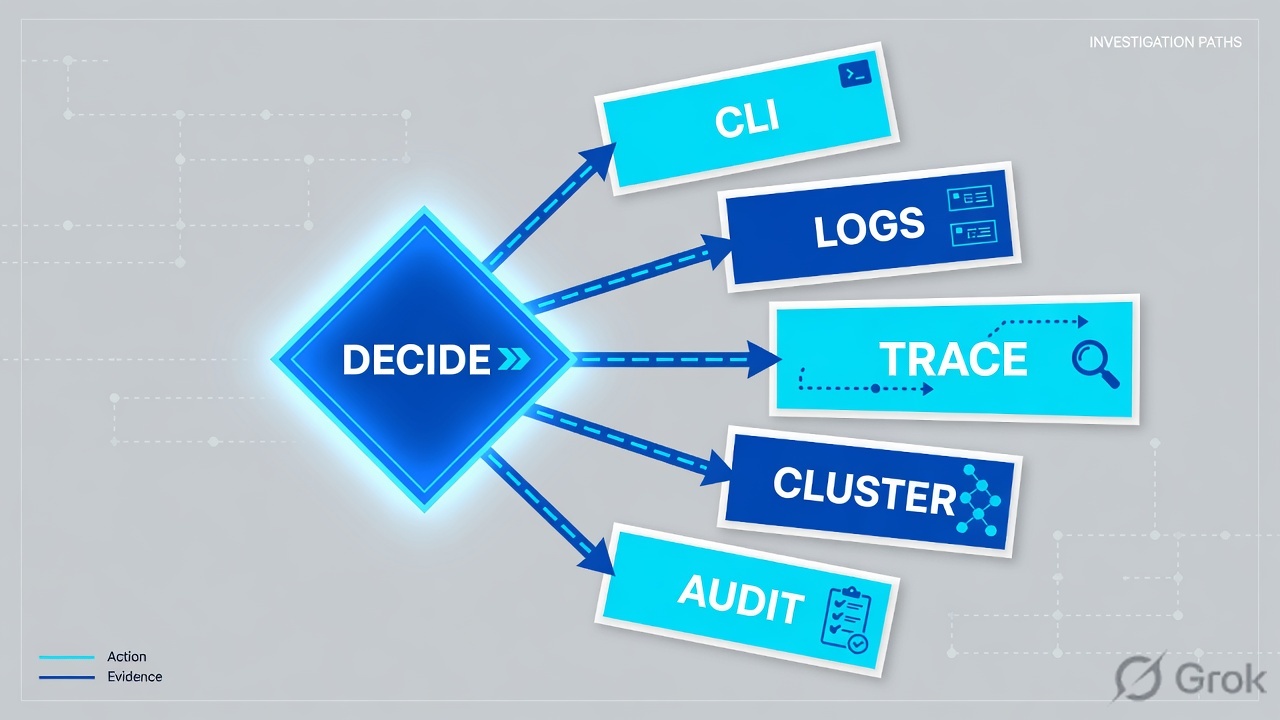
Read the diamond first. A private HQ file share never starts in Traffic analytics. A Failed WAN never starts as an SSID change. A Blocking uplink never starts as “rebuild Corp.”
4. How to choose — first tool + proof field
Print this next to Dashboard. If you cannot recite the proof field, you are not ready to change anything.
| If the ticket says… | First tool (official path) | Proof field | Do not open first |
|---|---|---|---|
| “Is Meraki even working?” / device offline / empty log | Confirm org + network, then Network-wide → Monitor → Event log | Event type + timestamp + device/client (and the product drop-down on a combined network) | A new Layer 3 Allow, or rebuild Corp |
| Branch cannot reach HQ file share / “VPN is down” | Security & SD-WAN → Monitor → VPN Status on the spoke (org-wide: Organization → Monitor → VPN Status) | Status (red / yellow / green) + VPN Registry + exported subnet Yes/No + NAT Type |
Rebuild the hub MX |
| Whole site internet dead or “slow” after a WAN change | Security & SD-WAN → Monitor → Appliance status → Uplink, then Traffic analytics if the WAN is Active | WAN Active / Ready / Failed / Not Connected; Event log primary uplink status change (uplink: 0 / uplink: 1) |
A Cloud / L7 rule edit |
| One laptop cannot join Corp / 802.1X / DHCP | Event log for access points, Client = that MAC — or Network-wide → Monitor → Clients → the client | 802.11 association (channel, rssi) + 802.1X EAP success / failure + RADIUS vlan/group |
VPN Status, or disable 802.1X for the SSID |
| AP dark, wired port dead, suspected loop | Switching → Switches → that switch → Ports (or Switching → Switch ports) | RSTP state (Forwarding / Blocking) + blocking symbol (STP discarding) + LLDP neighbor; CDP for PoE / Voice VLAN |
A new SSID or a hub rebuild |
The VPN Status page reports the primary WAN interface’s connectivity to the VPN registry. If the primary WAN is down and another WAN is Active, the page can still report no registry connectivity. Quote Appliance status Active / Failed next to Registry. Do not declare “AutoVPN is dead forever” from one red bar on the old primary.
Combined network: Network-wide → Configure → General → Traffic analysis. Basic disables the Traffic analytics page (Application details on the client still works). Detailed: collect destination hostnames enables Network-wide → Monitor → Traffic analytics. The table officially excludes applications under 0.1% of network traffic. Empty analytics with Traffic analysis Disabled is expected — it is not a Layer 7 block.
5. Runbook Side A → B → C
Side A proves the network is the right one, then the Event log, then the WAN / application. Side B proves the wireless client handshake. Side C proves the AutoVPN spoke and the switch neighbor. On a messy Sev-2, do them in this order until a field lights up.
Side A — Picker, Event log, WAN, Traffic (MX / network-wide)
-
Name the organization and the network
Top-left picker. If the ticket is BR-PUNE and the picker says HQ-Lab, stop. The factory lesson is this miss. Source: Managing Multiple Networks with Configuration Templates; Combined Dashboard Networks.
-
Open Event log, not Firewall
Path: Network-wide → Monitor → Event log. Combined network: drop-down next to Event log → for security appliances (or APs / switches). Filter Client = MAC / hostname / custom name. Use Before for the ticket window. Timestamps use the network time zone. Source: How to Use the Meraki Event Log.
-
Read the MX event types that close a “is it working?” ticket
Appliance status = primary uplink events. Meraki VPN = AutoVPN connectivity. Filtering = content filtering / Security Center URL blocks. DHCP / IP conflict. VRRP = warm spare. Offline devices keep events locally and upload later with the original timestamps — late rows are not “Dashboard invented them.”
-
If the complaint is WAN or “no internet,” open Appliance status
Path: Security & SD-WAN → Monitor → Appliance status → Uplink. Quote
Active(healthy and sending client traffic),Ready(healthy, waiting on Primary uplink),Failed(cannot reach the Meraki cloud),Not Connected, orDisabled. Pair with Event log primary uplink status change — official:uplink: 0= Internet 1,uplink: 1= Internet 2. Also Bad Gateway:No_lan_connectivityvsNo_inet_connectivity. Source: How to Configure MX and Z-Series Uplink Settings; Connection Monitoring for WAN Failover. -
If the WAN is Active and they named an app, open Traffic analytics
Path: Network-wide → Monitor → Traffic analytics (requires Detailed / hostname visibility). Quote application, destination hostname or IP, usage, flows, clients. Then, if you suspect an L7 deny, Event log filter L7 deny (NBAR: destination port, protocol, destination IP, NBAR ID). HTTP Hostname / Geo IP L7 rules use the legacy engine and do not write Event log rows — official caveat. Source: Next-Gen Traffic Analytics with NBAR; Hostname Visibility.
Network-wide / Monitor / Event log · for security appliances
Event log
| Time | Device | Client | Event type | Details |
|---|---|---|---|---|
| 02:04:11 | MX-PUNE-A | — | Appliance status | primary uplink status change · uplink: 1 |
| 02:04:18 | MX-PUNE-A | — | Meraki VPN | VPN Registry: Disconnected |
| 02:11:02 | MX-PUNE-A | — | Meraki VPN | peer HQ-LAN unreachable |
Source: Cisco Meraki — How to Use the Meraki Event Log (Network-wide → Monitor → Event log; combined-network drop-down; Client filter; Before; MX event types including Appliance status and Meraki VPN). Lab identities only. Training mock · not live.
Org / network:   Techclick-Lab / BR-PUNE   (picker, not HQ-Lab)
Path:            Network-wide → Monitor → Event log
Combined:        for security appliances
Quote:           02:04 IST · Appliance status · uplink: 1
                 02:04 IST · Meraki VPN · VPN Registry: Disconnected
Then:            Security & SD-WAN → Monitor → Appliance status → Uplink
Quote:           WAN1 Failed · WAN2 Active
Do not:          Save a new L3 allow from an empty HQ-Lab Event log
Side B — Wireless Event log / client
-
Open the AP Event log for that MAC, not Firewall
Same page: Event log drop-down → for access points. Client = MAC / hostname / custom name. Official troubleshooting also: Network-wide → Monitor → Clients (docs also say Network Wide → Monitor → Client) and jump to Event log filtered by that MAC. Source: How to Use the Meraki Event Log; Common Wireless Event Log Messages; Wireless Issue Resolution Guide.
-
Read association, then 802.1X, then DHCP
Success shape (official example):
802.11 association channel: 36, rssi: 53→802.1X authentication identity→802.1X EAP success→RADIUS response group / vlan. Failure shape:802.1X EAP failurethen802.11 disassociation. WPA-PSK success is aWPA authenticationrow. Hourly 802.1X re-authentication on WPA2-Enterprise is official normal rekey (3600 s) — not a loop. -
If association succeeded and DHCP failed, leave wireless policy alone
Official DHCP trap: VLAN tagging on the SSID or the upstream switch port. Path to check addressing: Wireless → Configure → Access Control → Client Addressing. Quote the Event log DHCP row, then the SSID VLAN, then the switch port VLAN — that is isolate. Changing the PSK is not.
Network-wide / Monitor / Event log / for access points
Event log · client aa:bb:cc:dd:ee:ff
| Time | Client | Event type | Details |
|---|---|---|---|
| 02:18:04 | priya-mbp | 802.11 association | channel: 36, rssi: 46 |
| 02:18:05 | priya-mbp | 802.1X EAP failure | identity: priya@lab.example · vap: 0 · radio: 1 |
| 02:18:05 | priya-mbp | 802.11 disassociation | client has left AP |
Access point: MR-PUNE-3F · Channel: 36 · Signal: 18 dB SNR
802.1X: last EAP failure — do not open Firewall first
Source: Cisco Meraki — Common Wireless Event Log Messages (802.11 association channel/rssi; 802.1X EAP success/failure; vap/radio); Clients List and Details (Access point, Signal, Channel). Lab identities only.
Path:            Network-wide → Monitor → Event log
Combined:        for access points
Client:          aa:bb:cc:dd:ee:ff
Quote:           802.11 association channel: 36, rssi: 46
                 802.1X EAP failure identity: priya@lab.example vap: 0
If DHCP after EAP success:
                 Wireless → Configure → Access Control → Client Addressing
                 then Switching → Ports VLAN vs SSID VLAN
Side C — VPN Status + Switch port / STP / CDP
-
Open VPN Status on the spoke, not the hub rebuild
Path: Security & SD-WAN → Monitor → VPN Status. Org-wide view: Organization → Monitor → VPN Status. If site-to-site VPN is not enabled on the selected network, the Security & SD-WAN link is hidden — use the Organization tab. Source: VPN Status Page; Meraki Auto VPN — Configuration and Troubleshooting.
-
Read Status, Registry, NAT Type, then exported subnets
Status: green = all peers reachable, yellow = some unreachable, red = peer unreachable.VPN RegistryConnected / Disconnected.NAT TypeUnfriendly = upstream NAT blocking hole-punch.Routing Errors= overlapping / conflicting subnets. Exported subnets tab: Name, Yes/No, Subnet, Router IP (from Addressing & VLANs). Latency 50% / 90% and Usage graphs are AutoVPN only — official: not collected for IPsec peers. -
If the AP or wired client is dark, open the switch port
Path: Switching → Switches → the switch → Summary (visual) or Ports (visual + detail). Network-wide: Switching → Switch ports. Quote
RSTP state: Enabled / Forwarding / Blocking / Disabled. Blocking symbol = STP discarding or LACP disabled.LLDPis the Dashboard neighbor column (searchlldp:"MR24"). CDP is official on Voice VLAN advertisements and PoE (Power Consumption / Power Request / Power Available) — not a separate “CDP neighbors” menu. MS Event log types: Spanning Tree, Switch port, Status (port carrier). Source: How to Monitor Switch Ports; Switch Ports; Troubleshooting PoE on MS switches.
Security & SD-WAN / Monitor / VPN Status · last 2 hours
VPN Status
| Peer | Status | Usage | Latency 50% | Exported |
|---|---|---|---|---|
| HQ-LAN | Red | — | — | 10.10.0.0/16 Yes |
| BR-BLR | Yellow | 12 MB | 41 ms | 10.30.0.0/16 Yes |
WAN1 Failed + WAN2 Active can still show Registry Disconnected on the old primary. Quote Appliance status next to this row.
Source: Cisco Meraki — VPN Status Page (Security & SD-WAN → Monitor → VPN Status; Organization → Monitor → VPN Status; Status colours; VPN Registry; NAT Type; exported subnets; primary-WAN caveat). Lab peers only.
Switching / Switches / MS-PUNE-3F / Ports · Port 24
Port 24 · MR-PUNE-3F uplink
STP discarding — port is not “dead”; RSTP is discarding to break a loop.
Event log · for switches · Event type Spanning Tree · same minute.
Source: Cisco Meraki — How to Monitor Switch Ports (RSTP state Enabled/Forwarding/Blocking/Disabled; blocking symbol = STP discarding or LACP disabled; LLDP column); Switch Ports search lldp:"…"; Troubleshooting PoE (CDP Power Consumption / Power Available). Lab names only.
- Side A picker: ticket network name in the top-left. Side A event: a row in that network’s Event log at the ticket minute. Side A WAN: Uplink
Activeon the link that should carry, and Traffic analytics shows the named app if Detailed is on. - Side B:
802.11 association+802.1X EAP success(orWPA authenticationon PSK) + a DHCP lease if the MX or upstream is the server. - Side C VPN: peer
Statusgreen,VPN RegistryConnected, exported subnet Yes. Side C switch:RSTP stateForwarding and LLDP names the expected neighbor.
6. Five tickets as full stories
These five land every quarter. Memorise first tool + proof field. Times and identities below are lab-only.
| Ticket | Symptom | First tool | Proof field |
|---|---|---|---|
| MEVD-01 | “Is Meraki even working?” / empty log / wrong picker | Network-wide Event log (after naming the network) | Event type + timestamp + device — or the empty log on the wrong network |
| MEVD-02 | Pune cannot open the HQ file share; Corp Wi-Fi associates | VPN Status on BR-PUNE | Status red to HQ-LAN + VPN Registry + exported subnet Yes/No |
| MEVD-03 | Whole branch internet died after a 02:00 WAN change | Appliance status → Uplink | Failed / Active / Ready + Event log primary uplink status change |
| MEVD-04 | One laptop cannot join Corp | Event log for access points, Client = MAC | 802.11 association + 802.1X EAP success/failure |
| MEVD-05 | AP dark; users say “the switch killed Wi-Fi” | Switching → Switches → Ports | RSTP state Blocking + LLDP neighbor + STP Event log |
MEVD-01 — Prove the Event log (is Meraki even working?)
01:42 · P2. Slack: “Is Meraki even working?” Someone already drafted a Corp rebuild. The last engineer left the picker on HQ-Lab.
First tool: say the org and the network out loud. Switch to the ticket network. Then Network-wide → Monitor → Event log. Combined: pick the product type. Filter Client if they named a user. Set Before to just after the complaint. Official: Event log uses the network time zone.
If the log is empty on HQ-Lab: that is the proof you were in the wrong store. It is not a tenant outage. Switch to BR-PUNE and search again.
If the log has rows: quote type + time + device. Appliance status / Meraki VPN / 802.11 / Spanning Tree each send you to a different second tool. The Event log is the pointer, not the WAN verdict.
Do not trust a colleague’s Event log screenshot from another network. Offline MX/MR/MS keep events locally and upload later with original timestamps — a “late” row is not Dashboard inventing history.
MEVD-02 — Prove the spoke (VPN Status)
02:05 · P2. Pune users associate on Corp. They cannot open the HQ file server. L1 wants the hub MX rebuilt.
First tool: on BR-PUNE, Security & SD-WAN → Monitor → VPN Status. If the VPN Status link is missing, site-to-site VPN is not enabled on this network — use Organization → Monitor → VPN Status.
Proof field: peer HQ-LAN Status red; VPN Registry Disconnected or Connected; exported subnet for the file-server VLAN Yes or No; NAT Type / Routing Errors. Association on Corp already proved wireless. Rebuilding a green hub is change-control, not isolate.
I would not rebuild HQ. I would quote Registry + peer Status + the exported-subnet Yes/No for 10.10.0.0/16. Then Appliance status if Registry is Disconnected on a Failed primary WAN (official primary-WAN caveat).
MEVD-03 — Prove the WAN (Appliance status / Traffic analytics)
02:20 · P1. Whole Pune floor lost internet after a 02:00 ISP change. Traffic analytics looks empty. Someone wants a new L7 allow.
First tool: Security & SD-WAN → Monitor → Appliance status → Uplink. Quote WAN1 Failed or Not Connected, WAN2 Active or still Ready.
Proof field: Ready means healthy and not carrying — official: awaiting failover from Primary uplink under Security & SD-WAN → Configure → SD-WAN & traffic shaping → Primary uplink. Pair Event log primary uplink status change (uplink: 0 / uplink: 1) and Bad Gateway (No_lan_connectivity vs No_inet_connectivity). Historical loss to 8.8.8.8 can show 100% if ICMP is blocked upstream while the uplink still works — official. Do not declare the circuit dead from that graph alone.
If the WAN is Active and they named Salesforce, then Traffic analytics (Detailed) or client Application details. Empty analytics with Traffic analysis = Disabled / Basic is expected.
Empty Traffic analytics is the clue the WAN never carried, or Detailed is off. Quote Uplink status + the primary-uplink Event log row. Do not Save an L7 allow on a Failed WAN.
MEVD-04 — Prove the handshake (Wireless Event log / client)
02:40 · P2. Priya cannot join Corp. The SSID is up. L1 wants 802.1X disabled.
First tool: Event log for access points, Client = aa:bb:cc:dd:ee:ff. Or Clients → priya-mbp → Event log.
Proof field: 802.11 association channel / rssi then 802.1X EAP failure (or success + DHCP fail). Association without EAP success is a credential / RADIUS problem, not an MX Layer 3 deny. If every client on one AP fails DHCP, official next click is Wireless → Configure → Access Control → Client Addressing and the upstream trunk VLAN — not a PSK change.
Hourly 802.1X rows on WPA2-Enterprise are official rekey, not a flapping client. vap: 0 is SSID #1. Disabling 802.1X for the floor is change-control.
MEVD-05 — Prove the port (RSTP + LLDP / CDP)
03:00 · P2. MR-PUNE-3F is dark. Users say the switch “killed Wi-Fi.” Someone wants RSTP disabled network-wide.
First tool: Switching → Switches → MS-PUNE-3F → Ports. Find the AP uplink. Quote the visual blocking symbol and RSTP state Blocking / STP discarding. Quote LLDP = MR-PUNE-3F so you know you have the right port. Event log for switches, type Spanning Tree / Switch port / Status.
Proof field: Blocking means RSTP is discarding to break a loop — official wording: the port discards traffic because it would introduce a routing loop. That is isolate. Disabling RSTP is how you melt the floor. CDP belongs on PoE / Voice VLAN (Power Available vs Power Consumption), not as a substitute for RSTP state.
I would leave RSTP enabled. I would paste RSTP state + LLDP neighbor + the Spanning Tree Event log row. Orange BPDU conflict or red Loop Inconsistent is the next sentence, not “reboot the stack.”
7. Traps + close-the-ticket proof
| You see | Weak close | Strong close |
|---|---|---|
| Event log empty | “Meraki is down” / rebuild Corp | Quote the picker. Switch network. Re-search Event log. Then Appliance status if still empty. |
| MX online in Dashboard | “Meraki is fine” | You only proved cloud reachability. Open VPN Status or Uplink for the ticket. |
| WAN2 Ready | “We have failover so we are good” | Ready is not carrying. Quote which uplink is Active. Event log primary uplink status change. |
| Traffic analytics empty | A Layer 7 rule blocked the internet | Confirm Traffic analysis = Detailed. Then Uplink Active/Failed. HTTP Hostname L7 has no Event log row. |
| VPN Status Registry Disconnected | Rebuild the hub | Quote Registry + peer Status + exported subnet. Check primary-WAN caveat vs Appliance status. |
| SSID visible, client fails | Disable 802.1X | Event log: 802.11 association + 802.1X EAP success/failure. Then DHCP / VLAN. |
| Hourly 802.1X rows | RADIUS is flapping | Official WPA2-Enterprise rekey every 3600 s. Not a ticket by itself. |
| Port blocking symbol | Disable RSTP / reboot the stack | RSTP state Blocking + LLDP neighbor + Spanning Tree Event log. Discarding is loop prevention. |
| Historical 100% loss to 8.8.8.8 | Circuit is dead | Official: ICMP may be blocked upstream. Confirm Active and a Traffic analytics or client flow. |
- Organization + network name written next to the tool you opened.
- Event log time zone called out (network TZ, Before field).
- One transaction quoted: Event type + time, or VPN
Status+ Registry + exported subnet, or UplinkActive/Ready/Failed, or 802.11 + 802.1X, or RSTP + LLDP. - Next tool named — or change-control owner named. No Save without residual control.
- Peer or second site compared when you claim “not a tenant outage.”
- Do not paste a real username and MAC together into a public chat.
I name the question, then the first tool, then one official field. Event log proves the event. VPN Status proves the spoke. Appliance status proves Active vs Ready vs Failed. Wireless Event log proves association and 802.1X. Switch Ports prove RSTP and the LLDP neighbor. I do not change Corp, Layer 3, or AutoVPN until that field is on the ticket. Factory model: wrong network dashboard is the classic miss.
Knowledge check
Six night-shift judgments. Each maps to a first tool or a proof field. Check answers, then Reset if you picked the wrong surface.
Sources
- Cisco Meraki — How to Use the Meraki Event Log (Network-wide → Monitor → Event log; combined-network drop-down; Client / Before filters; MX / MR / MS event types)
- Cisco Meraki — How to View Old Event Logs (Before field + Search)
- Cisco Meraki — VPN Status Page (Security & SD-WAN / Organization → Monitor → VPN Status; Status colours; Registry; NAT Type; exported subnets; primary-WAN caveat)
- Cisco Meraki — Site-to-site VPN Troubleshooting (VPN Status first; Unfriendly NAT; Registry Disconnected)
- Cisco Meraki — Meraki Auto VPN — Configuration and Troubleshooting
- Cisco Meraki — How to Configure MX and Z-Series Uplink Settings (Appliance status → Uplink; Active / Ready / Failed / Disabled / Not Connected)
- Cisco Meraki — Connection Monitoring for WAN Failover (Event log primary uplink; uplink: 0 / uplink: 1)
- Cisco Meraki — Next-Gen Traffic Analytics with NBAR (Network-wide → Configure → General → Traffic analysis; Detailed enables Traffic analytics; L7 deny Event log)
- Cisco Meraki — Hostname Visibility (Network-wide → Monitor → Traffic analytics; < 0.1% exclusion)
- Cisco Meraki — Common Wireless Event Log Messages and Issues (802.11 association channel/rssi; 802.1X EAP; vap/radio)
- Cisco Meraki — Troubleshooting Wireless Issues (Event log filtered by client MAC)
- Cisco Meraki — Clients List and Details Page Overview (Access point, Signal, Channel; Event log jump)
- Cisco Meraki — Event Log Shows Wireless Client Authenticating Every Hour (WPA2-Enterprise 3600 s rekey)
- Cisco Meraki — How to Monitor Switch Ports (Switching → Switches → Ports; RSTP state; blocking symbol; LLDP)
- Cisco Meraki — Switch Ports (Switching → Monitor → Switch Ports; RSTP; Voice VLAN CDP/LLDP; search lldp:"…")
- Cisco Meraki — Troubleshooting PoE on MS Switches (CDP Power Consumption / Power Request / Power Available)
- Cisco Meraki — MS Event Log Entries and Definitions (Spanning Tree, Switch port, Status)
- Cisco Meraki — Combined Dashboard Networks
- Cisco Meraki — Clients Usage Page Overview (Network-wide → Monitor → Clients)
Related: Blog 1 · Meraki session factory · Cisco Meraki interview hub · AutoVPN / SD-WAN · SSID security · MS switching · All lessons