Do not troubleshoot “Forcepoint.” Troubleshoot one transaction. Write user or Source IP, destination, and UTC first. Transaction Viewer answers “did this HTTP/HTTPS request hit Forcepoint Web — and which Action / Policy?” NGFW Logs answers “did this connection Allow, Discard, or Refuse — and which Rule Tag?” A DLP incident answers “which policy, action plan, and channel fired?” A saved DLP rule is not live until Deploy. Test Filtering is a predicted URL-filter action, not a Log Database row. Slack’s verb is not the action plan.
1. Why a war-room is not a dashboard tour
The weak close is “I opened Security Manager.” The strong close is one named field on a timestamp for the same user who called. Operators collapse three products into one shout. Web policy blocked an attachment. An NGFW Access rule Discarded 443 after a 02:00 install. DLP still Blocks on the Web channel because the action plan never changed — or Deploy never ran. Those are three first clicks and three different consoles.
This page is the command center for the bridge. The session factory taught the message path. The evidence desk maps first tool to proof field. Here you learn the war-room order: lock the sample, form a falsifiable hypothesis, open only the console that can prove it, then change one object — or hand off the package.
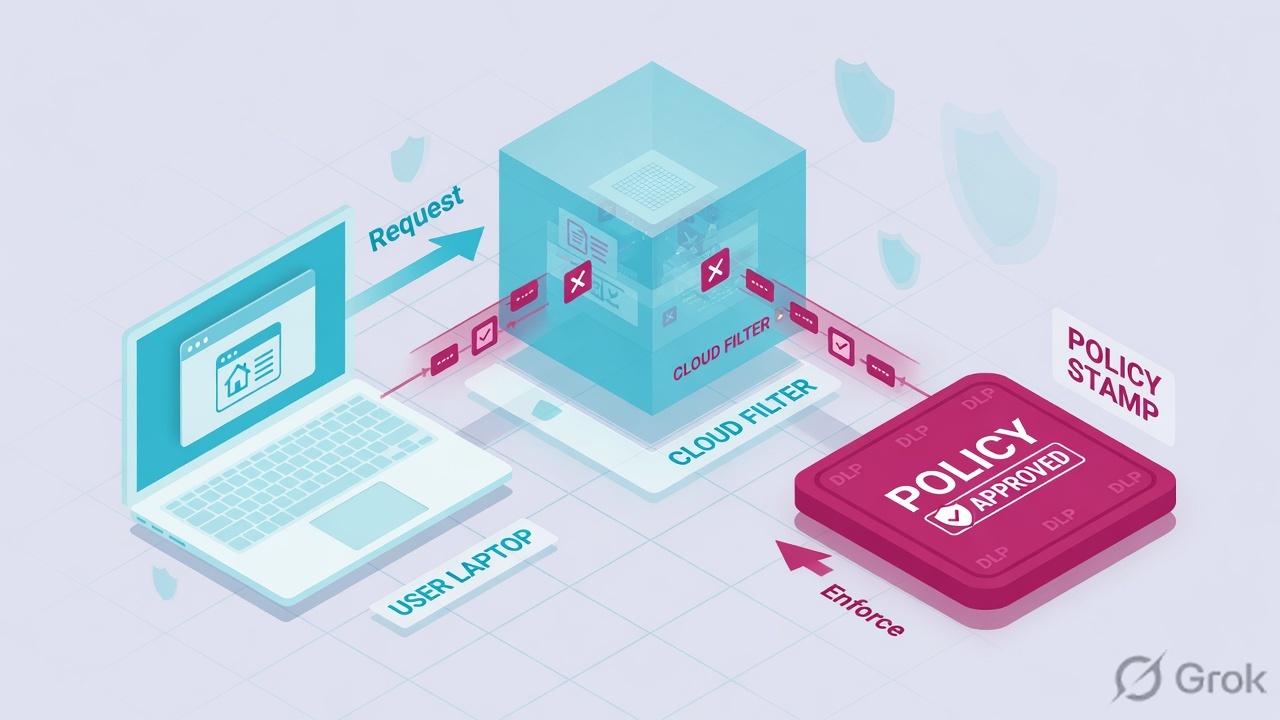
Action + Policy (or NGFW Rule Tag, or DLP action plan). The editor screenshot is not the stamp. Quote the log, then change the object that wrote it.If they say “walk me through a Forcepoint Sev-2,” do not list every module. Say: “I lock one user, one destination, one UTC window. I prove the Web request in Transaction Viewer Action + Policy, the firewall connection in NGFW Logs Action + Rule Tag, and the data hit on a DLP incident ID. I do not click Deploy or Save and Install until that field is on the ticket.”
Three people open three consoles on three different users. Network republishes Web. DLP Deploy-s every pending change. NGFW installs an unrelated Access policy. You now have three new variables and still no row for Priya at 01:42. One sample. One console. One field. Then you are allowed to change one object.
2. Mental model — one transaction, three consoles
Concept first. Forcepoint is not one dashboard. A war-room ticket lands on Web (Filtering Service / cloud proxy), NGFW (SMC Logs), or DLP (incident list). Each console is allowed to prove one claim. Over-claiming a field is how you ship a bad Deploy at 02:10.
Path second. Write the sample, then pick the surface. Do third — Side A, B, C below — only after the diamond says so.
1 · Lock the sample
User or source IP, destination URL or Dst Addr, exact UTC, expected result. This is the control transaction for every later click. A second laptop is a second ticket.
2 · Transaction Viewer
Cloud / Forcepoint ONE: Reporting → Report Center → Transaction Viewer. Proves one HTTP/HTTPS request: Action, Policy, Category, User, Source IP, URL. Does not prove an NGFW Discard or a DLP action plan.
3 · NGFW Logs
SMC Logs view, Records arrangement. Official first step when traffic is incorrectly stopped: filter Src Addr + Dst Addr, then click Rule Tag if Action is Discard or Refuse. Bytes Sent is not an Allow.
4 · DLP incident
On-prem: Data → Main → Reporting → Data Loss Prevention → Incidents (last 3 / 7 days). Cloud: Reporting → Report Center → Incident Manager. Quote ID, Policy, Action (action plan), Channel. An event is not an incident.
5 · Policy name vs Rule Tag
Web attribute Policy = the web policy used for filtering. DLP column Policy = policies the content violated. NGFW does not put a friendly policy name on the log — it puts Rule Tag (RULE_ID). Quote the field the console actually has.
Hard words, once
Filtering Service = on-prem engine that applies Web policy. Log Database = what Transaction Viewer reads. SMC = NGFW Security Management Center. Action plan = DLP disposition. Deploy = activates saved DLP changes. Save and Install = NGFW policy onto the engine.
Read left → right. Each box is allowed one claim. If you cannot name the field, you are not in RCA — you are still in hypothesis.
I lock one transaction. I prove the Web row, then the NGFW connection, then the DLP incident. I do not change a category, an Access rule, or an action plan until I can quote the field that made me do it. Deploy is a change. The re-test field is the close.
3. Decision flow — lock, then pick the surface
Flowchart first. Do not open Policy Management, an NGFW Access policy, or DLP Severity & Action until a diamond says so.
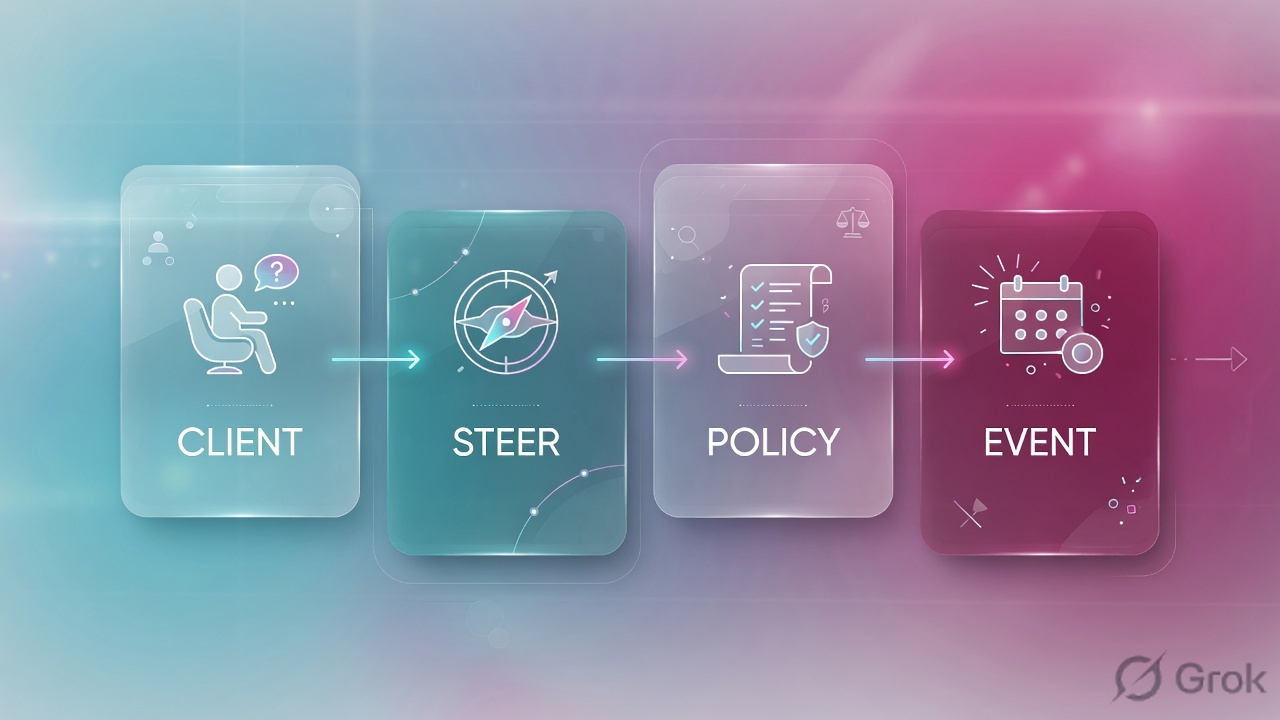
Read the diamond first. If two tools disagree, keep both outputs. The tool closest to the enforcement point owns the close.
War-room timeline (keep it separate from the hypothesis list)
Time-ordering stops two classic failures: treating a yesterday incident as tonight’s proof, and blaming the 02:00 install only because it is nearby.
| Clock | What you write | What you refuse to write |
|---|---|---|
| T−30 | First report, population, whether Web / NGFW / DLP had a publish, Deploy, or Save and Install | “Forcepoint is down” |
| T−20 | One locked sample: user or IP, dest, UTC, expected result | A second laptop as the same ticket |
| T−10 | Arrival evidence: TV row exists? NGFW Event? DLP incident ID? | Test Filtering as the only arrival proof |
| T+0 | Failure boundary: named Action + Policy / Rule Tag / incident Action | A tenant-wide Allow |
| T+15 | Scoped change or handoff package + rollback + success field | Three pending Deploys at once |
| T+30 | Same user, same dest, same path — old failing field gone | “We clicked Deploy, so it is fixed” |
Hypothesis ladder — allowed vs falsified
Write the hypothesis as a sentence you can kill. If it cannot be killed by one official field, it is not a hypothesis — it is a vibe.
| Hypothesis | Allowed if | Falsified if |
|---|---|---|
| Request never hit Forcepoint Web | Transaction Viewer empty for that User / Source IP in the UTC window | A row exists — now read Action + Policy |
| Web policy blocked this URL | TV Action = Blocked (or Confirmed / Quota) and Policy names the object | Action = Allowed, or the grid is empty |
| NGFW Access rule discarded the port | Logs Event = Connection discarded · Action = Discard / Refuse · you clicked Rule Tag | Action = Allow on that Src/Dst/Service, or Logs empty because Location is wrong |
| DLP action plan blocked the upload | Incident Action = Block (or Quarantine) on the named Channel | Action = Audit only or Confirm; or no incident (only an Event ID) |
| Editor change never went live | Incident time is before Deploy, or last-deployment status is Failed for that component | Deploy succeeded before the incident and live Action already matches the editor |
| Authentication bypassed, so the default policy applied | TV User = Not available and Authentication Method = None (or unexpected) | User is populated and the assigned policy is the one you intended |
4. How to choose — first console + live field
Print this next to the bridge. If you cannot recite the live field, you are not ready to change anything. The evidence desk is the field map. This table is the war-room pick.
| If the bridge says… | First console (official path) | Live field | Do not open first |
|---|---|---|---|
| Laptop / hotel / “is Forcepoint even working?” | Reporting → Report Center → Transaction Viewer. Filter User or Source IP + last 15 minutes. On-prem live peek: Reporting → Real-Time Monitor. |
A row exists (or does not). Then User / Source IP + Action + Policy. Cloud: Filtering Source names Endpoint Web, GRE, IPsec, Cloud connection. |
A new category Allow · Test Filtering as the only close |
| One SaaS / URL blocked after a policy ship | Transaction Viewer. Enable Detail View → General + Request Details. | Action (Allowed / Blocked / Authentication Required / Confirmed / Quota) + Policy + Category + full URL |
NGFW Access policy · DLP action plan |
| Whole branch dead after a firewall / peer change | SMC Logs, Records. Official: Troubleshoot traffic that is incorrectly stopped — filter source and destination, then click Rule Tag. |
Action (Allow / Discard / Refuse) + Rule Tag + Event (New connection / Connection discarded) + Dst Addr |
A Web category edit · DLP Deploy |
| “We set the DLP rule to monitor and it still blocks” | On-prem: Data → Main → Reporting → Data Loss Prevention → Incidents. Cloud: Incident Manager. Then check whether Deploy ran. | Incident ID + Policy + Action (action plan) + Channel. Official: changes save on OK; they are not activated until Deploy. |
A Web category Allow · trusting the rule editor screenshot |
User = Not available / “wrong policy” |
Same Transaction Viewer row. Columns User, Source IP, Authentication Method. |
Official cloud note: User can be Not available when authentication is bypassed. Quote method + the Policy that applied. |
Rebuild directory · invent a person from DHCP |
Web Security Toolbox → Test Filtering takes a user or IP plus a URL and returns the site category, the action applied, and the reason. Help states it provides information only for URL filtering. It is a predicted action. It is not a Log Database row, not a DLP incident, and not an NGFW Rule Tag. If Test Filtering says Block and the user still reaches the site, open Transaction Viewer — empty usually means the request never hit Filtering Service.
DLP Help — Deploy button: policy and configuration changes are saved to the management server as soon as an administrator clicks OK. They are not activated until Deploy. Deploy pushes rules, exceptions, resources, content classifiers, and tasks to protectors, agents, gateways, and endpoint hosts. NGFW uses Save and Install onto the engine. A green “OK” on a rule page is not a live action plan.
5. Runbook Side A → B → C
Concept: three sides, one sample. Path: Web first (most tickets start as “a site is broken”), then NGFW if the Web grid is empty or the symptom is a port, then DLP if Slack said “data / payroll / USB.” Do: the steps below. On a messy Sev-2, walk them in order until a field lights up. Then stop opening consoles.
Side A — Transaction Viewer (Web request)
-
Open Transaction Viewer, not the policy editor
Path: Reporting → Report Center → Transaction Viewer. Official: Using the Transaction Viewer. Filter
UserorSource IP+ the UTC window on the locked sample. Add URL / Domain / Cloud App if you already know the destination. On-prem you can peek live on Reporting → Real-Time Monitor, but the close field still lives in the Log Database. -
If the grid is empty, stop hunting Action
Empty is the off-cloud sentence. Traffic never reached Content Gateway, Endpoint Web, GRE/IPsec, or the cloud connection. Quote “no Transaction Viewer row for this User / Source IP in this window.” Fix forwarding, or go to Side B. Do not publish a category Allow from an empty report.
-
Read the columns that close a Web ticket
Enable Detail View (or double-click the row). Official tabs: General lists user, policy, action, Web category, risk class. Request Details lists full URL, source and destination IP, referrer, request method. Advanced lists HTTP status, authentication method, user agent. Cloud
Actionvalues: Allowed, Authentication Required, Blocked, Confirmed, Quota. QuoteAction+Policy+Category. -
Read User / Source IP before you invent a person
Cloud Help:
Usercan show Not available for transactions where authentication has been bypassed. Also quoteAuthentication Method(Basic, Downstream Authentication, Endpoint, Form-based login, NTLM, Single sign-on, or None) andFiltering Source. Empty User is data. It is not “Forcepoint is down.”
Reporting / Report Center / Transaction Viewer · Detail View on
Transaction Viewer
| User | URL / App | Category | Action | Policy | Source IP |
|---|---|---|---|---|---|
| priya@lab.example | outlook.office.com | Webmail | Allowed | Corp-Web-Default | 203.0.113.41 |
| priya@lab.example | attachment.outlook.office.com | Webmail | Blocked | Corp-Web-Default | 203.0.113.41 |
REQUEST DETAILS: URL = attachment.outlook.office.com · Src = 203.0.113.41 · Method = POST
Do not add a second category Allow for outlook.office.com. Change the object that wrote this row.
Source: Forcepoint Help — Using the Transaction Viewer; Transaction Viewer display options (Detail View: General, Request Details, Cloud Apps, Threat Details); Web attributes (Action, Policy, Category, User, Source IP). Lab identities only. Training mock · not live.
On-prem Web module, right pane Toolbox: Test Filtering (user or IP + URL → category, action, reason — URL filtering only), Check Policy (which policy is assigned), URL Access, Investigate User. Use them to form a hypothesis. Close the ticket from Transaction Viewer or a DLP incident, not from the popup.
Side B — NGFW Logs (connection)
-
Open the SMC Logs view, not Web Report Center
A discarded TCP port will not appear as a Web
Categoryhit. Official: What the Logs view shows. Use the Records arrangement. Official first step when traffic is incorrectly stopped: add a quick filter for both source and destination IP in the Query pane, then Apply. If NAT sits between your Management Client and the Log Server, select the correct Location or you will see no rows. -
Read Action, then click Rule Tag, then Event
Exportable Firewall fields (official):
Action= Allow, Discard, Refuse, Terminate, Wait for further actions, Wait for authentication.Rule Tag= rule tag of the rule that triggered the log event (RULE_ID).Event= New connection, Connection closed, Connection discarded. Official troubleshoot article: if the connection is discarded or refused by a rule, click the Rule Tag link in the log entry to open that Access rule. Also quoteSrc Addr,Dst Addr,Service,Situation, andAuth. Userwhen identity is on the rule. -
If several Access rules match, the topmost applied rule wins
Official: open Search Rules, drag the matching elements, Show Only Matching Rules, deselect Do Not Match ANY. The topmost matching Access rule is applied unless the Source VPN cell does not match. Then check Protocol Agent / Service, Connection Tracking, NAT (dynamic NAT is TCP/UDP only), and routing — packets drop when the engine has no route.
-
Do not treat Bytes Sent as an allow
Bytes Sent/Bytes Rcvdare counted when accounting entries are created — often at close. A sample of bytes is notAction = Allowon the ticket that just died. Quote the connectionEventthat flipped.
Logs / Records / Query: Src Addr = 203.0.113.0/24 · Dst = 198.51.100.20
Logs view
| Event | Action | Rule Tag | Src Addr | Dst Addr | Service |
|---|---|---|---|---|---|
| New connection | Allow | @209.15 | 203.0.113.41 | 203.0.113.10 | HTTPS |
| Connection discarded | Discard | @214.02 | 203.0.113.41 | 198.51.100.20 | HTTPS |
Src Addr 203.0.113.41 → Dst Addr 198.51.100.20 · Service HTTPS
Official next click: Rule Tag, not a Web category Allow.
Source: Forcepoint NGFW Help — What the Logs view shows; Exportable Firewall and Layer 2 Firewall log entry fields; Troubleshoot traffic that is incorrectly stopped by the firewall (click the Rule Tag link). Lab addresses are RFC 5737. Training mock · not live.
Side C — DLP incident (data hit)
-
Open the incident list, not Transaction Viewer Category
On-prem: Forcepoint Security Manager → Data → Main → Reporting → Data Loss Prevention → Recent Reports → Incidents (last 3 days) or Incidents (last 7 days). Official: Viewing the incident list. Cloud Web: Reporting → Report Center → Incident Manager. A Web
Categoryof Webmail is not a DLPChannel. -
Quote ID, Policy, Action, Channel, Source
Table properties (official):
ID(incident, a policy violation),Event ID(any transaction the engine saw),Policy,Action(from the action plan),Channel(Email, Web, FTP, Endpoint application, Endpoint printing, Network printing),Source,Destination,Severity(High / Medium / Low),Status,Incident Time. Select the row — the preview pane shows the rest. Cloud Incident Manager Detail View tabs: Matches / Source & Destination / Properties. -
Read the action plan, not the Slack verb
Possible actions (official): Permit, Block, Audit only, Quarantine, Confirm, Encrypt, Drop attachments, and channel-specific variants. Audit only permits the activity and logs an incident. If Slack said “DLP blocked us” and
Actionis Audit only, the product did not block. Confirm is a user prompt, not a silent Block. The default after a dismissed Confirm is configured on Settings → General → Endpoint (Block or Permit) — quote that if the channel is Endpoint. -
If the editor says Monitor but the incident still says Block, ask Deploy
Official Deploy button: OK saves to the management server; Deploy activates across protectors, agents, gateways, and endpoint hosts. The button to the left of Deploy shows last-deployment status. A component that was down misses the push and receives pending updates when it returns. Quote incident time versus Deploy time. Do not argue with Finance from the rule tree.
Data / Main / Reporting / Data Loss Prevention / Incidents (last 3 days)
Incidents (last 3 days)
| ID | Incident Time | Policy | Action | Channel | Severity | Status |
|---|---|---|---|---|---|---|
| 884102 | 01:12 UTC | PII-Web-Monitor | Audit only | Web | Low | New |
| 884188 | 02:06 UTC | Payroll-Web-Block | Block | Web | High | New |
Source = priya@lab.example · Destination = https://drive.lab.example/upload
Editor said “monitor.” Live Action is still Block. Check the action plan + whether Deploy ran.
Source: Forcepoint DLP Help — Viewing the incident list; Table Properties tab (ID, Policy, Action, Channel, Source, Severity; event vs incident); Possible actions for an action plan; Deploy button. Lab identities only. Training mock · not live.
LOCKED SAMPLE
  User / Src:    priya@lab.example  ·  203.0.113.41
  Destination:   (URL or Dst Addr + Service)
  UTC window:    01:50–02:20
  Expected:      (Allowed / Permit / upload succeeds)

WEB  path:  Reporting → Report Center → Transaction Viewer
WEB  quote: Action + Policy + Category + User / Source IP + URL
            (empty grid = forwarding — not a category Allow)

NGFW path:  SMC Logs → Records
NGFW quote: Action + Rule Tag + Event + Src Addr + Dst Addr
            (Discard / Refuse → click Rule Tag)

DLP  path:  Data → Main → Reporting → Data Loss Prevention
            (cloud: Reporting → Report Center → Incident Manager)
DLP  quote: ID + Policy + Action + Channel + Source + Severity
            Deploy time vs Incident Time

CHANGE: one object · owner · rollback · success field
CLOSE: same sample, old failing field gone- Side A wire: Transaction Viewer has a row for that User / Source IP in the window. Side A policy: the same row names
Action+Policy. - Side B: Logs
Event+Action+Rule Tagmatch the minute the site recovered. You clicked Rule Tag; you did not guess the Access rule. - Side C: incident
IDnamesPolicy+Action+Channel. After Deploy, re-test produces either no new incident or a different action plan — not a second silent Block.
6. Four war-room tickets
These four land on the same bridge. Times and identities below are lab-only. Memorise the first console and the live field — not the Slack title.
| Ticket | Symptom | First console | Live field |
|---|---|---|---|
| FPCC-01 | Bridge opens; three teams talking; no sample | Lock user + dest + UTC on the channel, then pick A / B / C | The written sample itself — no field until this exists |
| FPCC-02 | After a new Web policy, Outlook Web loads, attachments fail | Transaction Viewer Detail View | Action = Blocked · Policy + Category on the attachment URL |
| FPCC-03 | Pune internet dead since 02:00 firewall change; Web empty | NGFW Logs → Records | Action + Rule Tag (click it) + Event = Connection discarded |
| FPCC-04 | Finance: rule set to monitor; payroll upload still blocked | DLP Incidents / Incident Manager, then Deploy status | ID + Policy + live Action + Channel + Deploy time |
FPCC-01 — Lock the sample before anyone clicks
01:38 · P2. Slack is a pile of screenshots. L1 already drafted a tenant-wide category Allow. Network wants Save and Install. DLP wants Deploy. Nobody can name the user.
First move: write one sample on the bridge: priya@lab.example or 203.0.113.41, destination, 01:42 UTC, expected result. Then pick Side A, B, or C from the diamond. Do not open three consoles on three different people.
Proof field: the written sample. Until it exists you are not in RCA. A second laptop is a second ticket — it can confirm blast radius after the first sample has a field.
Do not treat “everyone in Finance” as a sample. Filter one person. If their Transaction Viewer is empty and their NGFW log is Discard, you have a connection problem, not a department problem.
FPCC-02 — Prove the SaaS transaction (Action + Policy)
02:05 · P2. Outlook on the Web opens. Attachments fail after last night’s policy ship. Someone wants “another Allow for outlook.office.com.”
First console: Transaction Viewer. Filter User + Cloud App / URL + last hour. Enable Detail View. Official General tab lists policy and action; Request Details lists the full URL.
Proof field: page host Action = Allowed; attachment host Action = Blocked and Policy = the policy you shipped (plus Category). That name is the ticket. Change that one policy — or the classifier that fed it — then re-read the same two columns. When risk class is Security, Threat Details appears — quote it if L1 called this “malware.”
I would not add a second category Allow. I would quote Action + Policy on the attachment transaction. A saved policy is not proof until the same filter returns Allowed (or the action you intended).
FPCC-03 — Prove the NGFW connection (click Rule Tag)
02:20 · P1. Pune branch: every desk lost internet after a 02:00 firewall change. Transaction Viewer for that Source IP range is empty. L1 wants a Web policy republish.
First console: SMC Logs → Records. Filter Src Addr for the branch and the destination you still think is allowed, 01:50–02:20 UTC. Official article: Troubleshoot traffic that is incorrectly stopped.
Proof field: Action = Discard (or Refuse), Rule Tag of the Access rule that flipped, Event = Connection discarded, Dst Addr of the VIP or service. Click the Rule Tag. Empty Web is the clue the packet never reached Filtering Service. Simultaneous 02:00 death is almost never “everyone’s Web cookie expired together.”
Quote Logs Event + Action + Rule Tag. Restore the Access rule or the NAT that used to carry 443, Save and Install that one policy, then wait for Action = Allow and the first Transaction Viewer row. Do not publish a Cloud App exception on an empty Web log.
FPCC-04 — Prove the live DLP action (incident + Deploy)
03:00 · P2. Finance: “We changed the payroll rule to monitor. Uploads of customer records still block. Normal reports go through.” Someone typed Sev-1 and drafted a Web category Allow.
First console: Data → Main → Reporting → Data Loss Prevention → Incidents (last 3 days). Filter Source + Channel = Web. Cloud tenants: Incident Manager.
Proof field: incident ID + Policy + live Action + Channel + Severity + Incident Time. Then ask: did Deploy run after the editor change? Official: OK saves; Deploy activates. If live Action is still Block, the action plan on the matching rule is still Block — or another policy (EDM / IDM / dictionary) still matches with a Block plan. If live Action is Audit only, the product permitted the upload and logged it — that is not a Block. A category Allow will not change an action plan.
I would leave Web categories alone. I would paste incident ID, Policy, Action, Channel, and Deploy time. Change-control is a scoped exception or a Severity & Action edit on that one rule — with an owner — then Deploy, then the same upload. Not a night-shift Block All → Permit flip.
Traffic / system logs can show events with no incident. Official table properties: an Event ID is any transaction the engine saw; an ID is a policy violation. “DLP is broken” is the weak close. Threshold, action plan, or an off-box component that never received Deploy is the strong next check.
7. Traps + evidence package
| You see | Weak close | Strong close |
|---|---|---|
| No locked sample | Three consoles, three users | Write user + dest + UTC. Then pick one console. |
| Empty Transaction Viewer | “Forcepoint is down” / new category Allow | Quote no row for this User / Source IP; fix forwarding or open NGFW Logs |
| Row exists, still failing | “Forcepoint is fine” | You only proved the wire. Read Action + Policy on that URL. |
| Action = Allowed | “Forcepoint is working” | Allowed is a Web verdict, not an NGFW Allow and not a DLP Permit. |
| Test Filtering says Block | Trust the popup and republish | Official: URL filtering only. Confirm with a Transaction Viewer row. |
| User = Not available | Rebuild directory / “user missing” | Official bypass wording. Quote Authentication Method + Source IP + the policy that applied. |
| NGFW Bytes Sent > 0 | “Rule is fine” | Read Event + Action + click Rule Tag. |
| SMC Logs empty | NGFW is down | Wrong Location when NAT sits in front of the Log Server. Select Location, then re-query. |
| DLP Action = Audit only | “DLP blocked us” | Audit only permits and logs. Quote the action plan name. |
| Editor says Monitor, live Action = Block | Argue from the rule tree | Quote incident time vs Deploy time. Another policy may still match. |
| Traffic log has events, no incident | “DLP is broken” | An event is any transaction. An incident is a policy violation. |
| OK clicked on a DLP page | “Change is live” | Official: not activated until Deploy. |
- Locked sample: user or
Source IP, destination, UTC window, expected result. - One transaction quoted: Web
Action+Policy, or NGFWAction+Rule Tag(and that you clicked it), or DLP incidentID+Channel+ liveAction. - Identity quoted when policy looks “wrong”:
Useror official Not available +Authentication Method. - If DLP: Deploy time versus Incident Time. Last-deployment status if a component is Failed.
- Scoped change named — or owner named. One object. Rollback named. Success field named.
- Same sample re-tested. Old failing field gone. Test Filtering never used as the only close.
Unsafe path
Republish every Web policy. Save and Install the whole NGFW policy tree. Deploy every pending DLP change. Disable SSL. Fail over the cluster. Add a tenant-wide category Allow. None of those isolate one transaction.
Safe path
One sample. One console. One field. One object. Owner + rollback + success field. Re-test the same upload / URL / port. Then widen the blast-radius check to a peer host.
I do not troubleshoot Forcepoint. I troubleshoot one transaction. I prove the Web request in Transaction Viewer, the connection in NGFW Logs by clicking Rule Tag, and the data hit on a DLP incident. Slack’s verb is not the action plan. OK is not Deploy. Deploy is not proof — the re-test field is. Field map: Forcepoint evidence desk. Factory model: session factory.
Knowledge check
Six war-room judgments. Each maps to a locked sample, a first console, or a live field. Check answers, then Reset if you picked the wrong surface.
Sources
- Forcepoint Help — Using the Transaction Viewer (Reporting → Report Center → Transaction Viewer; Detail View tabs; View Transactions from Report Builder)
- Forcepoint Help — Web attributes (
Action,Policy,Category,User/ Not available,Source IP,Authentication Method,Filtering Source) - Forcepoint Help — Transaction Viewer display options (Detail View: General, Request Details, Cloud Apps, Threat Details)
- Forcepoint Help — Using the Transaction Viewer (on-prem Web) (Report Center → Transaction Viewer; filters and columns)
- Forcepoint Help — Test Filtering (Toolbox; URL filtering only; category, action, reason)
- Forcepoint Help — Real-Time Monitor in multiple Policy Server deployments (Web module → Reporting → Real-Time Monitor)
- Forcepoint NGFW Help — What the Logs view shows (Records / Statistics / Details; Location when NAT is in front of the Log Server)
- Forcepoint NGFW Help — Exportable Firewall and Layer 2 Firewall log entry fields (
Action,Rule Tag,Event,Src Addr,Dst Addr,Auth. User) - Forcepoint NGFW Help — Troubleshoot traffic that is incorrectly stopped by the firewall (filter source and destination; click the Rule Tag link; topmost matching Access rule; Protocol Agent; NAT; routing)
- Forcepoint NGFW Help — Define Action options in Access rules (Allow, Continue, Discard, Refuse)
- Forcepoint DLP Help — Viewing the incident list (Data → Main → Reporting → Data Loss Prevention)
- Forcepoint DLP Help — Table Properties tab (
ID,Policy,Action,Channel,Source,Severity; Event vs incident) - Forcepoint DLP Help — Possible actions for an action plan (Permit, Block, Audit only, Quarantine, Confirm)
- Forcepoint DLP Help — Deploy button (OK saves; Deploy activates across protectors, agents, gateways, endpoint hosts)
- Forcepoint Help — Using the Incident Manager (Reporting → Report Center → Incident Manager; Matches / Source & Destination / Properties)
Related: Forcepoint evidence desk — first tool + proof field · Forcepoint session factory · Forcepoint DLP channels · Forcepoint DLP policies and rules · Forcepoint interview hub · All lessons