packet-tracer is a virtual packet — paste the final Action. Connection events name who handled the session — paste Access Control Rule + Action + Reason. show conn is live — paste flags and bytes. Captures prove the packet moved — paste counts on both interfaces, then a traced packet if you need a Snort verdict. Predicted is not established. Block + Intrusion Block on an Allow rule is IPS, not a missing ACP line.
Tracer Action allow is predicted. I will not add an Allow until show conn flags are UIO or events say Intrusion Block. If CAPI has the SYN and CAPO is empty, the packet never left outside.
1. Why prove beats Deploy
A night ticket is a 5-tuple plus a panicked paste. The last engineer already ran packet-tracer. Someone wants a new Allow. Your job is to prove what the box already decided — predicted path, logged event, live flags, or packets on the wire — before you touch change-control.

FTD packet processing is two engines. The packet hits the ingress interface and LINA. If policy requires inspection, Snort returns a verdict. LINA then drops or forwards. That is why one tool is never enough: tracer can ALLOW while the handshake never completes, and an Allow rule can still log Action: Block with Reason: Intrusion Block.
RFC 5737 / training only. Host 10.10.8.22:51922 on inside to 198.51.100.80:443. Interface PAT 203.0.113.20. Next hop 198.51.100.1. Rule 14 Finance-SaaS Allow with IPS Balanced. Confirm live syntax on your version before you type on a customer box.
2. Four tools, four proof fields
Pre-train the vocabulary before the tickets. Each tool answers one question. Mixing them is how interviews fail.

packet-tracer
Virtual packet through LINA + Snort. CLI: packet-tracer input <ifc> …. FMC 7.1+: Devices → Troubleshoot → Packet Tracer. Proof field: final Action plus the ACCESS-LIST / SNORT phase.
Connection events
A log of connections the managed device monitored. Path: Analysis → Connections → Events. Proof fields: Access Control Rule, Action, Reason. Empty table is not “allowed.”
show conn
Live LINA table. show conn address 10.10.8.22. Proof fields: flags and bytes. Official FTD flags: U up, I initiator data, O responder data. saA is not established.
Captures
LINA: capture CAPI interface inside … / CAPO on outside. Optional trace detail then show capture CAPI packet-number 1 trace. Snort-level: capture-traffic. Proof field: packet counts both sides, then the SNORT phase if you traced.
Predicted means the tracer built a synthetic packet. Initiator / responder in events are session roles, not always source / destination of an attack. Reason: Intrusion Block means Snort blocked (or would have blocked) an exploit — FMC still shows Action Block even when the matching ACP rule is Allow. Capture w/Trace is the FMC wizard that wraps a LINA capture with trace.
3. First-tool decision
Do not start every ticket on CLI. Start from what the user already handed you. The diamond is the first tool. The box under it is the field you paste.
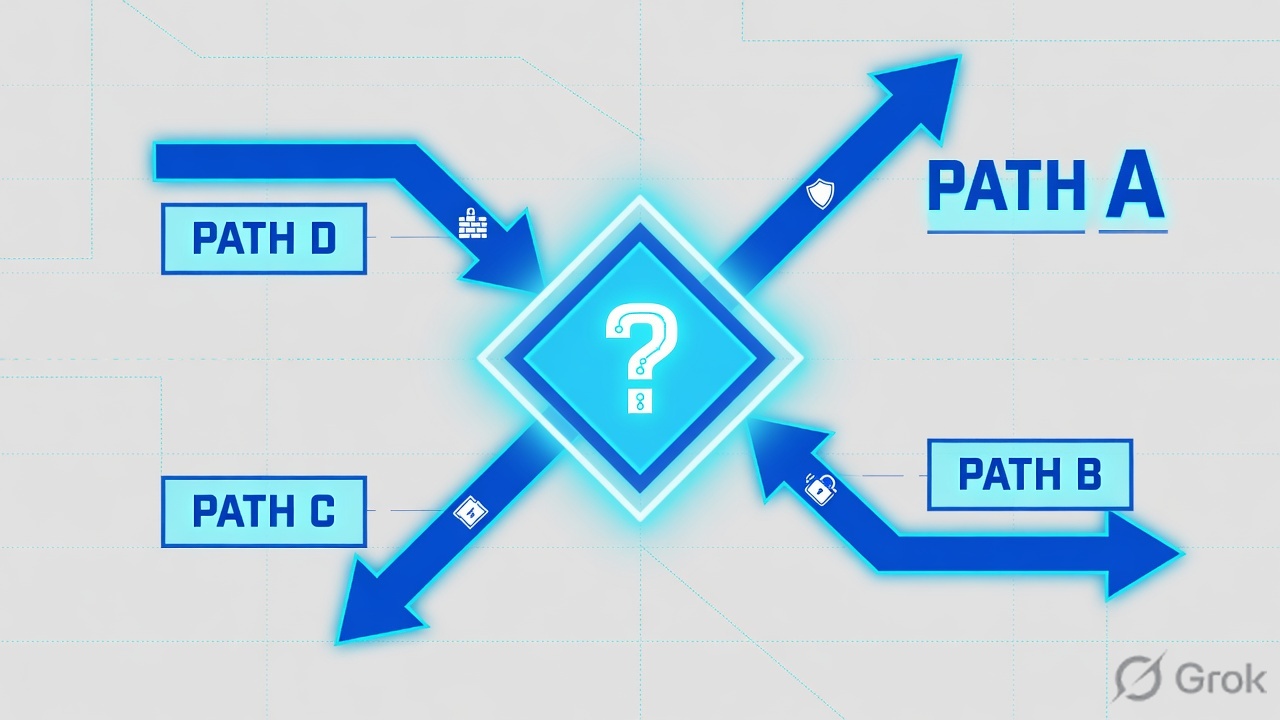
Read the diamond, then the green proof line. Ticket 4 re-uses events because the field that matters is Reason, not a second Allow.
4. How to choose
Same 5-tuple in every tool. If you mix hosts, the desk fails. Source for the table: FMC 7.4 connection-event fields, TAC 212474 captures / packet-tracer, FTD command reference show conn.
| Ticket smell | First tool | Proof field you paste | Not first |
|---|---|---|---|
| “Firewall is blocking HTTPS” | Analysis → Connections → Events | Access Control Rule + Action | A new Allow |
| Engineer pasted tracer ALLOW | packet-tracer input inside tcp … | Final Action (predicted) | Deploy |
| Session exists, app still fails | show conn address | flags + bytes | Intrusion policy guess |
| Allow rule, resets after signatures | Connection events | Reason: Intrusion Block + Action: Block | Stack another Allow |
| One-way after WAN / PAT change | LINA capture pair | CAPI vs CAPO counts | ACP edit |
| Events table is empty | Rule Logging tab + time range | Log at Beginning / End enabled? | “Must be allowed” |
| Need Snort verdict on a real packet | capture … trace then show capture … packet-number 1 trace | Phase Type: SNORT Result | Tracer alone |
Devices → Troubleshoot → Packet Tracer
Packet Tracer · ftd-lab-01
Exact fields from TAC 222151 / 212474: Ingress Interface, Protocol, Source IP, Source Port, Destination IP, Destination Port. CLI twin: packet-tracer input inside tcp 10.10.8.22 51922 198.51.100.80 443. Path on FMC 7.1+: Devices → Troubleshoot → Packet Tracer. Older 6.2 wizard: Devices → Device Management → Troubleshoot → Advanced Troubleshooting → Packet Tracer. Predicted only.
Analysis → Connections → Events
Connection Events · last 15 minutes
| First Packet | Initiator | Responder | AC Rule | Action | Reason |
|---|---|---|---|---|---|
| 02:08:14 | 10.10.8.22 | 198.51.100.80:443 | Default Action | Block | — |
| 02:11:03 | 10.10.8.22 | 198.51.100.80:443 | Finance-SaaS | Block | Intrusion Block |
Exact fields from FMC 7.4 Connection Events: Access Control Policy, Access Control Rule (syslog AccessControlRuleName), Action (AccessControlRuleAction), Reason (AccessControlRuleReason), Initiator/Responder IP. Path: Analysis → Connections → Events. If a graph appears, switch workflow to the predefined Connection Events table. Ticket 1 reads row 1. Ticket 4 reads row 2.
5. Five tickets
Each ticket is first tool, proof field, dummy output, what you say, next tool. Lab output is training-shaped. Confirm live syntax from the cited Cisco page before you type on a real pair.
Ticket 1 — “The firewall is blocking HTTPS”
Symptom: user and manager agree FTD is blocking. No flags. No capture. Someone already drafted an Allow.
First tool
Analysis → Connections → Events. Filter Initiator IP 10.10.8.22, Responder Port 443, widen the time window if the table is empty.
Proof field
Access Control Rule + Action. On this lab row: Default Action / Block. Reason is blank — that is still a verdict.
First Packet          02:08:14
Initiator IP          10.10.8.22
Responder IP          198.51.100.80
Responder Port        443
Access Control Policy LAB-ACP
Access Control Rule   Default Action
Action                Block
Reason                —
What you say: The session was handled by the policy default action, Action Block. I am not adding Finance-SaaS until this row names a different rule. FMC 7.4: Action Default Action means the access control policy default action handled the connection.
Next tool: If the table is empty, do not invent “allowed.” Check the matching rule Logging tab (Log at Beginning of Connection / Log at End of Connection), the time range, and the device filter. Then run packet-tracer to see which rule-id the virtual packet hits.
Empty events is a logging or filter problem until proven otherwise. Blocked connections usually log beginning-of-connection. Allowed connections need logging enabled on the rule, unless an intrusion / file event auto-logged them.
Ticket 2 — Engineer already pasted ALLOW
Symptom: last engineer ran tracer. Action allow. User still cannot finish HTTPS. They want Deploy.
First tool
Repeat tracer yourself on the Active unit. CLI or Devices → Troubleshoot → Packet Tracer. Same 5-tuple. Do not trust a screenshot from another host.
Proof field
Final Action: allow plus the ACCESS-LIST remark and SNORT verdict. This is predicted. Say that word out loud.
> packet-tracer input inside tcp 10.10.8.22 51922 198.51.100.80 443
Phase: 1 Type: ACCESS-LIST Result: ALLOW
  Access Group: CSM_FW_ACL_  Rule: Finance-SaaS  rule-id 268436482
Phase: 2 Type: NAT Result: ALLOW
  Untranslate 10.10.8.22/51922 to 203.0.113.20/18422
Phase: 3 Type: ROUTE-LOOKUP Result: ALLOW
  found next-hop 198.51.100.1 using egress ifc outside
Phase: 4 Type: SNORT Result: ALLOW
  Firewall: allow rule  Verdict PASS
Result: input-interface: inside  output-interface: outside  Action: allow
What you say: Predicted allow through ACCESS-LIST, NAT, route, and Snort. TAC 212474 is explicit: packet-tracer generates a virtual packet. A capture taken at Snort-level during tracer can even show that synthetic ICMP or TCP. It is not the user’s live handshake.
Next tool: show conn address 10.10.8.22 — Ticket 3. Do not open change-control for a new Allow from this paste.
Action allow is not “user works.” If you Deploy from tracer alone you are gambling.
Ticket 3 — Session exists, app still fails
Symptom: tracer ALLOW. A row is in the conn table. Browser still spins. Hypothesis: handshake never completed.
First tool
show conn address 10.10.8.22 on the Active unit. Same 5-tuple as tracer. Optional: show conn detail to read the official flag legend.
Proof field
flags + bytes. Lab: saA, 2844 bytes. Not UIO.
TCP outside 198.51.100.80:443 inside 10.10.8.22:51922, idle 0:00:48, bytes 2844, flags saA

Flags (FTD command reference):
  s  awaiting outside SYN
  a  awaiting initiator ACK to SYN
  A  awaiting responder ACK to SYN
  U  up
  I  initiator data
  O  responder data
What you say: Live flags are saA. Official FTD legend: awaiting outside SYN and both ACKs. That is not UIO. Cisco’s own example of an active session is flags UIO with inbound and outbound data. Predicted ALLOW next to saA means path, server, or return NAT — not a missing Allow.
Next tool: If you need the wire, go to Ticket 5 (captures). If flags later go UIO and the app still resets, go to Ticket 4 (events Reason).
Do not call saA “established.” Do not call UIO “IPS clean.” UIO only proves the handshake and both data directions existed in LINA.
Ticket 4 — Allow rule, resets after a signature update
Symptom: Rule 14 Finance-SaaS is Allow with IPS Balanced. Occasional resets after last night’s SRU. Tracer still ALLOWs a virtual packet. Flags may already be UIO then drop.
First tool
Analysis → Connections → Events for the same 5-tuple. Then Analysis → Intrusions → Events for the GID/SID. Do not start in ACP editor.
Proof field
Action: Block + Reason: Intrusion Block + Access Control Rule: Finance-SaaS.
Access Control Policy   LAB-ACP
Access Control Rule     Finance-SaaS
Action                  Block
Reason                  Intrusion Block
Initiator IP            10.10.8.22
Responder IP            198.51.100.80
Application Protocol    HTTPS
What you say: FMC 7.4 is explicit: for connections where the system blocks an intrusion, the event Action is Block even though you used an access control Allow rule to invoke deep inspection. Reason Intrusion Block is paired with Action Block for a blocked exploit. Change-control is the intrusion policy (tune or suppress that SID), not a second Allow stacked above 14.
Next tool: Open the matching intrusion event (View intrusion events for a connection). Name GID/SID. Only then write a change ticket on the intrusion policy. Snort 3 note from the same chapter: a “would have dropped” result leaves Reason blank instead of Intrusion Block — treat that as Allow-shaped, not a silent IPS emergency.
Action Block on an Allow rule is not “ACP is broken.” It is deep inspection doing its job. Do not Trust the subnet to “fix” a signature.
Ticket 5 — One-way after the outside IP moved
Symptom: Finance can SYN. Nothing useful comes back after last week’s WAN cutover. Tracer ALLOW. Flags stay saA. Events show Allow or are empty.
First tool
LINA capture pair on Active. Inside uses the real host. Outside uses the PAT address. FMC twin: Devices → Device Management → Troubleshoot → Advanced Troubleshooting → Capture w/Trace.
Proof field
CAPI packet count versus CAPO packet count. Then show capture CAPI packet-number 1 trace if you need the SNORT phase on a real packet.
> capture CAPI interface inside match tcp host 10.10.8.22 host 198.51.100.80 eq 443
> capture CAPO interface outside match tcp host 203.0.113.20 host 198.51.100.80 eq 443
> show capture
capture CAPI type raw-data interface inside [Capturing - 752 bytes]
  match tcp host 10.10.8.22 host 198.51.100.80 eq 443
capture CAPO type raw-data interface outside [Capturing - 0 bytes]
  match tcp host 203.0.113.20 host 198.51.100.80 eq 443

> capture CAPI2 interface inside trace detail trace-count 100 match tcp host 10.10.8.22 host 198.51.100.80 eq 443
> show capture CAPI2 packet-number 1 trace
Phase: SNORT  Result: ALLOW  Snort Verdict: (pass-packet) allow this packet
Result: output-interface: outside  Action: allow
What you say: CAPI has the SYN. CAPO is empty — the packet never left outside, or I filtered the wrong post-NAT address. If CAPO later shows SYN and no SYN-ACK, the server or return path is the story. A traced real packet with SNORT ALLOW plus empty CAPO is path/NAT/adjacency, not IPS.
Next tool: show nat detail and show route for the xlate and next hop. Change-control is the NAT object or interface IP, then Deploy, then re-prove CAPI/CAPO. Optional Snort-level capture-traffic with -n host 10.10.8.22 and port 443 if you need to see the packet after it was handed to Snort.
FMC Capture w/Trace cannot specify source and destination ports in older wizards — use CLI when the 5-tuple needs ports. Always match CAPO on the PAT address, not the inside host. Clear captures when you close (no capture CAPI / no capture CAPO).
Devices → Device Management → ftd-lab-01 → Advanced Troubleshooting → Capture w/Trace
Add Capture · CAPI
Path from TAC 212474: Devices → Device Management → Troubleshoot icon → Advanced Troubleshooting → Capture w/Trace. CLI twin: capture CAPI interface inside match … and capture CAPI2 interface inside trace detail trace-count 100 match …. Older FMC wizards cannot set L4 ports — use CLI when the ticket is HTTPS-only.
6. Runtime path of one HTTPS flow
After go-live, one user packet walks this path. Each hop has a proof field. If you skip a hop, you will “fix” the wrong object.
If CAPI increments and CAPO stays zero, stop talking about ACP. If events say Intrusion Block, stop stacking Allows. If flags stay saA, stop calling tracer a close.

-
Side A — Confirm the 5-tuple and the unit
Write initiator, responder, ports, and ingress interface. Confirm you are not on standby before you read a conn table. Source: same discipline as the session-factory lesson; data-plane proof lives on Active.
-
Side B — First tool from the chooser
“Blocked” → events. “Already ALLOW” → tracer, then conn. “Session exists” → flags. “Allow + reset” → Reason. “One-way” → CAPI/CAPO. Do not run all four as a ritual if the ticket already named the smell.
-
Side C — Paste the proof field, then decide change-control
No named object, no Deploy. Intrusion Block → intrusion policy. Empty CAPO → NAT / route / adjacency. saA → path or server. Default Action Block → the rule that should have matched, or the default action you actually wanted.
I pick the first tool from the symptom, then I paste one field: tracer Action, event Rule plus Action plus Reason, conn flags, or both capture counters. Predicted is not established. Intrusion Block on an Allow rule is IPS.
7. Traps and proof
| Trap | Dummy tell | Desk move |
|---|---|---|
| Tracer = user works | Action: allow | Say predicted. Open show conn. |
| saA = established | flags saA | Name incomplete handshake. Official flags: s/a/A ≠ UIO. |
| Empty events = allowed | Blank table | Logging tab + time range + device filter first. |
| Allow rule cannot Block | Action: Block + Reason: Intrusion Block | IPS dropped after ACP Allow. Tune the SID. |
| Capture on inside host for CAPO | CAPO 0 bytes forever | Match the PAT address on outside. |
| One capture = path proof | CAPI only | Need both interfaces. SYN without SYN-ACK is return path. |
| ASP drop without a tuple | Shared counter | Hint only. Pair with capture or a 5-tuple. |
| FMC Success = proved | Deploy toast | Re-run tracer + conn + events after Deploy. |
- 5-tuple + ingress interface + which unit (Active).
- First tool used (events / packet-tracer / show conn / capture).
- Proof field: Rule + Action + Reason, or tracer Action, or flags + bytes, or CAPI/CAPO counts.
- If IPS: Reason Intrusion Block and the GID/SID from intrusion events.
- If path: PAT xlate and next hop only after CAPO is empty or SYN-only.
- Change-control: none, or named FMC object + Deploy + re-proof with the same tool.
Knowledge check
Six desk judgments. First tool and proof field — not folklore. Check, then Reset if you miss any.
Sources
- Use Firepower Threat Defense Captures and Packet Tracer — Document ID 212474. LINA
capture,capture … trace detail,show capture … packet-number 1 trace,capture-traffic,packet-tracer input, FMC Capture w/Trace and Packet Tracer wizards. - Replay a Packet Using Packet Tracer Tool in FMC — Document ID 222151. Path: Devices → Troubleshoot → Packet Tracer (FMC 7.1+).
- FMC 7.4 Connection and Security-Related Connection Events — fields Access Control Rule, Action, Reason; Analysis → Connections → Events; Intrusion Block on an Allow rule still logs Action Block.
- FMC 7.4 Connection Logging — when beginning vs end events are written; empty events when logging is off; default-action logging.
- Threat Defense Command Reference — show conn — flag legend (
a/A/s/U/I/O) and the UIO established example. - FMC 7.4 Intrusion Events — drill from a connection to the GID/SID.
Related: Session factory — LINA plus Snort · Access control policy · Snort 3 IPS · FTD NAT · HA troubleshooting · Cisco Secure Firewall hub