Lessons · FortiGate series · FortiAnalyzer store then hunt
This lesson is how FortiAnalyzer stores FortiGate logs and how you hunt them: ADOM, OFTP ingest, Analytics vs Archive, then FortiView / Log View / Reports. Packet drop RCA is debug flow. Tenant split on the firewall is VDOM — ADOM is the FAZ isolation, not a VDOM.
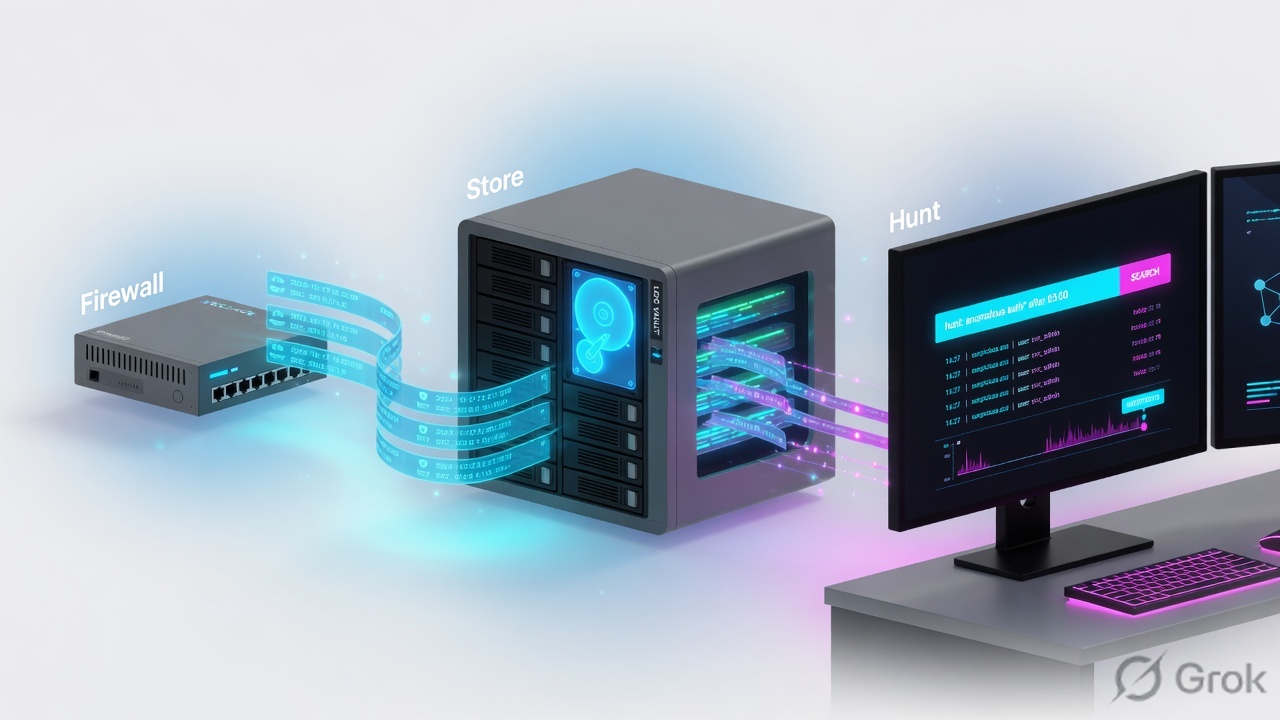
Enable ADOMs, put the FortiGate in one ADOM (Normal mode). On the FortiGate: config log fortianalyzer setting to 10.20.20.50, policy logtraffic all, then authorize the device on FAZ Device Manager. Logs land in Archive, then are indexed into Analytics (SQL). FortiView is ADOM-scoped summary. Log View / Threat Hunting is the SOC hunt. Reports need Analytics covering the report window. Proof: execute log fortianalyzer test-connectivity shows Registration registered, ADOM name, Log Tx & Rx — plus a Log View row. Lab: FGT 10.20.20.1, FAZ 10.20.20.50, ADOM LAB.
Why local logs are not a hunt
The day-one ticket is always the same: “FortiGate has the log, so FortiAnalyzer is broken.” Wrong. FortiGate disk / memory logs are a local buffer. FAZ only sees what OFTP delivered, what you authorized into the ADOM you are looking at, and what still sits in Analytics. Three silent-empty states look identical from the SOC chair:
- Device still unauthorized, or authorized into ADOM
LABwhile you hunt inroot. - OFTP is up, but the policy is
logtraffic disableorconfig log fortianalyzer filterdroppedforward-traffic. - Archive files exist; Analytics quota / insert lag / Collector mode means FortiView, Log View and Reports stay empty.
Historical FortiView on the FortiGate needs local disk logging and is a 7-day-class local view. FAZ FortiView is the ADOM SQL. Do not close a SOC ticket from the firewall GUI.
ADOM, ingest, index — three objects
An ADOM (administrative domain) is the FAZ tenant. When ADOMs are enabled, Device Manager, FortiView, Log View, Incidents & Events and Reports are per ADOM. You pick the ADOM at login. Super_User enables the feature; enabling logs you out. CLI: config system global set adom-status enable. Default is off.
Normal ADOM mode: one FortiGate in one ADOM. Advanced mode: VDOMs from the same FortiGate can sit in different ADOMs — more moving parts, only when you actually split tenants that way. You cannot put the same device in two ADOMs in Normal mode. FortiGate and FortiCarrier never share an ADOM. FortiMail / FortiWeb logging requires ADOMs on.
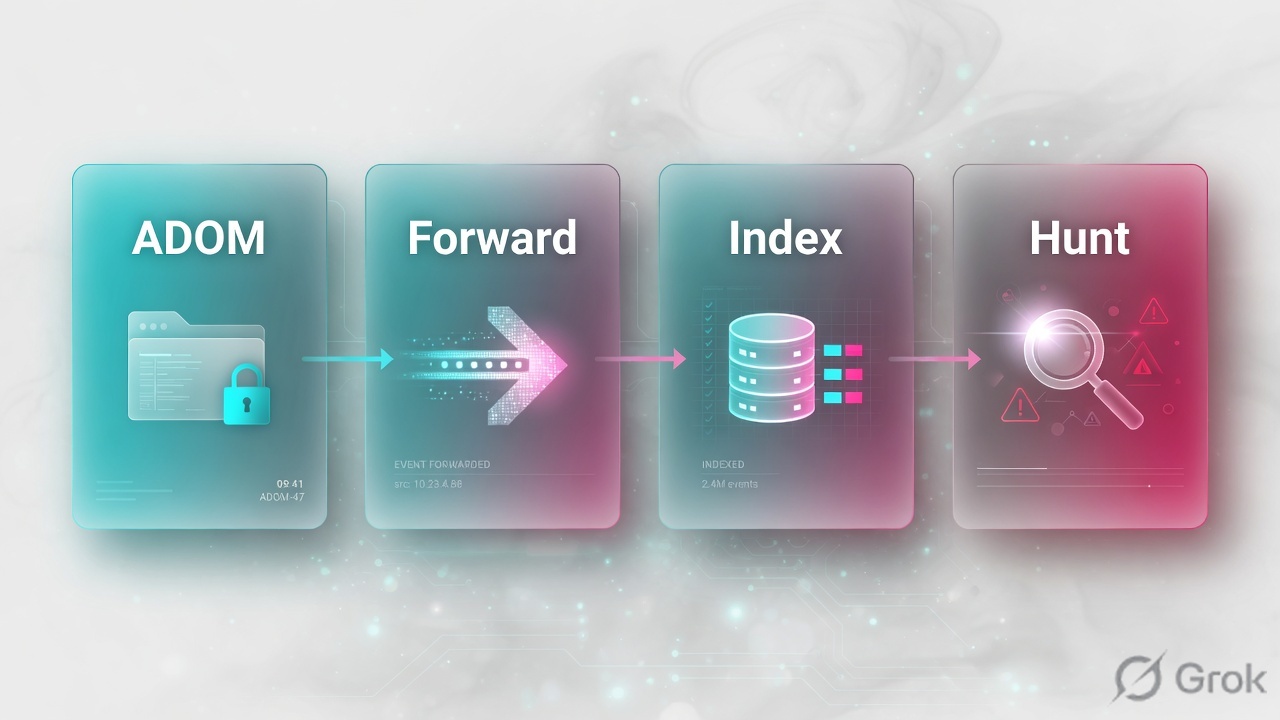
ADOM
System Settings › ADOMs. Lab: LAB, type FortiGate. Quota and data policy are per ADOM. Hunt the ADOM the device is in.
Ingest
FortiGate config log fortianalyzer setting + authorize on Device Manager. OFTP TCP 514. Reliable: set reliable enable (seq_no confirm queue).
Archive
Compressed / offline on disk. Rebuild SQL from it. Not immediately in FortiView, Log View, Incidents, or Reports. Log Browse still sees files.
Analytics
Indexed SQL. The only store FortiView, Log View (except Log Browse), handlers and Reports use. Data policy days are not Archive days.
The FortiGate sends. FAZ stores into an ADOM. Analytics indexes. Then I hunt Log View. FortiView summarises. Reports print. No Analytics, no hunt.
How a log becomes a hunt row
Policy must log. OFTP must deliver. Device must be authorized into this ADOM. Archive write, then SQL insert. Insert lag is a real ticket: Log Receive Monitor climbs, Insert Rate vs Receive Rate diverges, FortiView stays empty. Collector mode receives and archives; it does not FortiView, Report, or run Incidents & Events.
Read left → right, then the gold bar. Archive is the keep. Analytics is the hunt. Wrong ADOM is a silent empty Log View.
| Object | Lab value | If missing |
|---|---|---|
| FAZ IP | 10.20.20.50 reachable from FGT | test-connectivity Connect Error. OFTP never starts. |
| ADOM | LAB, type FortiGate, Normal mode | Hunt in root, device in LAB — empty FortiView. Quota fights the wrong disk. |
| Authorize | Device Manager › unauthorized → ADOM LAB | FGT thinks it sends. FAZ will not keep the device’s logs in that ADOM. |
| FGT setting | status enable · server 10.20.20.50 · upload-option realtime · reliable enable | UDP-syslog mental model. Reliable off + WAN blip = lost logs. |
| Policy log | LAN-to-WAN logtraffic all | Session exists, FAZ traffic Log View empty. Event logs may still arrive. |
| Analytics policy | 30 days indexed / 365 Archive (example) | 90-day Report empty while Archive still has the files. Fetch / rebuild SQL. |
FortiGate → FAZ is config log fortianalyzer setting. FAZ → other FAZ / syslog / CEF is System Settings › Advanced › Log Forwarding (config system log-forward). The SOC hunt ticket is almost always the first. Do not open FAZ log-forward because a branch is missing in Log View.
FortiView vs Reports vs Log View
Pick the pane that matches the question. Using Reports for a live brute-force, or FortiView for a PCI PDF, is how you waste an hour on a healthy ingest path.
Four columns, four tickets. A missing PDF is not a missing OFTP session unless Analytics is empty too.
| Need | Use | Skip |
|---|---|---|
| Who hit 203.0.113.80 in the last hour? | Log View › Traffic, filter dstip / dport. Threat Hunting if you are pivoting indicators. | Weekly 360 Security Review PDF. |
| Top talkers / threat map for the ADOM | FortiView dashboards / Monitors. Drill to related logs. | Building a custom dataset first. |
| PCI / weekly posture for management | Reports › template + schedule + output profile. Analytics must cover the window. | Sitting in FortiView and screenshotting. |
| Alert when VPN brute-force repeats | Incidents & Events › Event Handlers (log type, filter, group, threshold). Logs in this ADOM first. | A report schedule as an “alert.” |
| 90-day report, Analytics is 30 days | Log fetching (Fetcher Management) or import Archive, then generate. | Re-running the same empty report. |
Runbook Side A / B / C
Side A is ADOM and authorize. Side B is FortiGate send. Side C is hunt and proof. Do not start at Reports.
Side A — ADOM then authorize
-
Enable ADOMs
Super_User: Dashboards › Status › System Information › Administrative Domain ON. You are logged out. CLI
config system global set adom-status enable. Backup first — non-global config moves toroot. Source: FortiAnalyzer Administration Guide — Enabling and disabling the ADOM feature. -
Create ADOM LAB
System Settings › ADOMs › Create New. Name
LAB, type FortiGate. Set Analytics / Archive days and disk quota here — insufficient quota trims Analytics before the scheduled report finishes. Normal mode unless you are splitting VDOMs.
Device Manager › Unauthorized › Authorize
FGT-LAB
Source: FortiAnalyzer Administration Guide — Adding devices / Authorizing devices; Creating ADOMs (one device, one ADOM in Normal mode). OK here is not ingest. The FortiGate still has to send.
config system global
    set adom-status enable
    set adom-mode normal
end
# GUI: System Settings › ADOMs › Create New › LAB, type FortiGate
# Then Device Manager › authorize FGT-LAB into ADOM LAB
Side B — FortiGate send
Log & Report › Log Settings
Send logs to FortiAnalyzer
Source: FortiOS Administration Guide — Log settings and targets. 7.4+ also shows the same connector under Security Fabric › Fabric Connectors › Logging & Analytics. Upload-option: realtime / 1-minute / 5-minute / store-and-upload. Reliable is a separate knob.
-
Point the FortiGate at FAZ
set server 10.20.20.50,upload-option realtime,reliable enable. Optional: pinset serialto the FAZ serial. Filter: keepforward-traffic enablefor this lab. -
Log on the policy that you will hunt
LAN-to-WAN:
set logtraffic all. Security-event-only hides the HTTPS row you are about to search. Generate traffic from10.20.20.10to203.0.113.80:443.
config log fortianalyzer setting
    set status enable
    set server "10.20.20.50"
    set upload-option realtime
    set reliable enable
end
config log fortianalyzer filter
    set severity information
    set forward-traffic enable
end
config firewall policy
    edit 1
        set name "LAN-to-WAN"
        set logtraffic all
    next
end
Side C — hunt then prove
Log View › Traffic · ADOM LAB
Filter
Source: FortiAnalyzer Administration Guide — Filtering messages; Threat Hunting; How ADOMs affect FortiView. Empty here with FGT local logs present = ingest/ADOM, not a report-template bug. Handlers: Incidents & Events › Event Handlers, same ADOM.
-
Connectivity from the FortiGate
execute log fortianalyzer test-connectivity. Want: FortiAnalyzer Adom NameLAB, Registration registered, Connection allow, Log Tx & Rx. Connect Error = IP/route/514. Registered but 0 logs = filter / logtraffic / still unauthorized. Source: FortiOS execute log fortianalyzer test-connectivity; Fortinet Community connectivity tip. -
Rate on FAZ, then the row
diagnose fortilogd lograte-deviceand Dashboards › Status › Log Receive Monitor / Insert Rate vs Receive Rate. Then Log View row for 10.20.20.10. FortiView › Traffic should move after Analytics insert, not before. -
Handler only after the row exists
If Log View is empty,
diagnose test app sqllogd 200will not save you. Hit count on the handler increases only after matching Analytics logs. Source: Fortinet Community — event handler troubleshooting.
# FortiGate
execute ping 10.20.20.50
execute log fortianalyzer test-connectivity
# Adom Name: LAB
# Registration: registered
# Connection: allow
# Log: Tx & Rx
get log fortianalyzer setting
diagnose test application fgtlogd 1
# state=connected  reliable=1  server_log_status=Log is allowed.
diagnose test application fgtlogd 4
# faz= count must climb after diagnose log test / real HTTPS

# FortiAnalyzer
diagnose fortilogd lograte
diagnose fortilogd lograte-device
diagnose fortilogd logvol-adom LAB
# GUI: ADOM LAB › Log View › Traffic › srcip 10.20.20.10
test-connectivity: registered, ADOM LAB, Log Tx & Rx. FAZ lograte-device shows FGT-LAB. Log View in ADOM LAB has the 10.20.20.10:443 row. That is the close — not a green FortiGate interface and not a scheduled PDF.
One flow after go-live
Host 10.20.20.10 SYN to 203.0.113.80:443. FortiGate policy 1 accepts, logtraffic all. miglogd / fgtlogd OFTP to 10.20.20.50. FAZ oftpd accepts because FGT-LAB is authorized in ADOM LAB. Real-time file in Archive, then sqllogd indexes Analytics. FortiView Traffic widget moves. Log View filter srcip=10.20.20.10 returns the row. A matching event handler can now increment Log chk/hit. A report covering “last 24 hours” can chart it — only while those hours remain inside the Analytics data policy.

# 1) ADOM you are in vs ADOM the device is in
# 2) FortiGate
execute log fortianalyzer test-connectivity
diagnose test application fgtlogd 41
# memory / confirm queue for global-faz — stuck queue = OFTP down
# 3) FAZ widgets: Log Receive Monitor vs Insert Rate vs Receive Rate
# insert rate 0, receive > 0 → SQL insert stuck (sqllogd / quota)
# 4) Log View › Log Browse — files in Archive with no Analytics
# 5) Operation mode: Collector has no FortiView / Reports / Incidents
Traps + proof
| Symptom | Likely cause | Proof |
|---|---|---|
| FGT Forward Traffic yes, FAZ Log View empty | Unauthorized, wrong ADOM, or OFTP down. | Device Manager membership. test-connectivity Registration / Connect Error. Hunt in ADOM LAB, not root. |
| Registered, Tx & Rx, still no traffic logs | logtraffic disable or fortianalyzer filter dropped forward-traffic. | get log fortianalyzer filter. Policy show | grep logtraffic. Event logs may still appear. |
| Archive files, FortiView blank | Analytics not indexed: insert lag, ADOM quota, Collector mode. | Insert Rate vs Receive Rate. get system status operation mode. Log Browse vs Log View. |
| 90-day report empty, Archive 365 / Analytics 30 | Reports read Analytics only. | ADOM data policy days. Fetch Archive into Analytics, then generate. |
| Event handler never fires | No matching logs in this ADOM, handler disabled, threshold not met. | Log View first. Then diagnose test app sqllogd 200 conf adom=LAB handler=… Log chk/hit. |
| WAN blip, gap in FAZ, FGT local complete | Reliable off; confirm queue never built. | get log fortianalyzer setting reliable. fgtlogd 41 queue after a disconnect test. |
| Two tenants see each other’s logs | Both devices in the same ADOM, or admin assigned extra ADOMs. | System Settings › ADOMs membership. Admin ADOM list. Normal mode: one FGT, one ADOM. |
That is how MSSP isolation dies. Assign the SOC admin to ADOM LAB only. Super_User is for enable/create, not for daily hunt.
- ADOM
LABexists; FGT-LAB authorized there; you are logged into LAB. - FGT: server 10.20.20.50, realtime, reliable enable, policy logtraffic all.
- From 10.20.20.10: HTTPS to 203.0.113.80. test-connectivity → registered, ADOM LAB, Log Tx & Rx.
- FAZ
diagnose fortilogd lograte-devicemoves. Log View row srcip=10.20.20.10 dstport=443. - FortiView Traffic reflects the same ADOM. A report covering now has a count. Handler (if used) Log chk/hit increments.
Knowledge check
Six judgment items. Submit once. Reasons point back at the section to re-read.
Sources
- FortiAnalyzer Administration Guide — Enabling and disabling the ADOM feature; Creating ADOMs; ADOM device modes
- FortiAnalyzer Administration Guide — Analytics and Archive logs (indexed vs compressed; FortiView / Log View / Reports need Analytics)
- FortiAnalyzer Administration Guide — Analyzer and Collector feature comparison
- FortiAnalyzer Administration Guide — FortiView (how ADOMs affect FortiView; logs used for FortiView); Log View / Threat Hunting; Reports; Incidents & Events
- FortiOS Administration Guide — Log settings and targets (
config log fortianalyzer setting, upload-option, reliable) - FortiAnalyzer Administration Guide — Configuring log forwarding (FAZ→FAZ/syslog — not FortiGate ingest)
- Fortinet Community — Troubleshooting Tip: FortiGate to FortiAnalyzer connectivity (
execute log fortianalyzer test-connectivity; FAZdiagnose fortilogd lograte) - Fortinet Community — Event handler troubleshooting (
diagnose test app sqllogd 200)
Related: debug flow RCA · debug flow + session · FortiGate command center · VDOMs · Zones, policy, NAT